Once you have generated the four figures, you need somewhere to put them.
One particular difficulty of Tetriamancy is the chart: it is technically a three-dimensional object with figures on each of its parts, including the parts we cannot see.
After much experimentation, I can tell you what I do. You may find a better method, but this is as good a starting point as any.
Instructions
- Draw two long vertical lines.
- Draw six horizontal lines across the vertical lines.
- The lines should stretch as far out as the two vertical lines are apart.
- Draw a final horizontal line (seventh), splitting the vertical lines into eight equal sections.
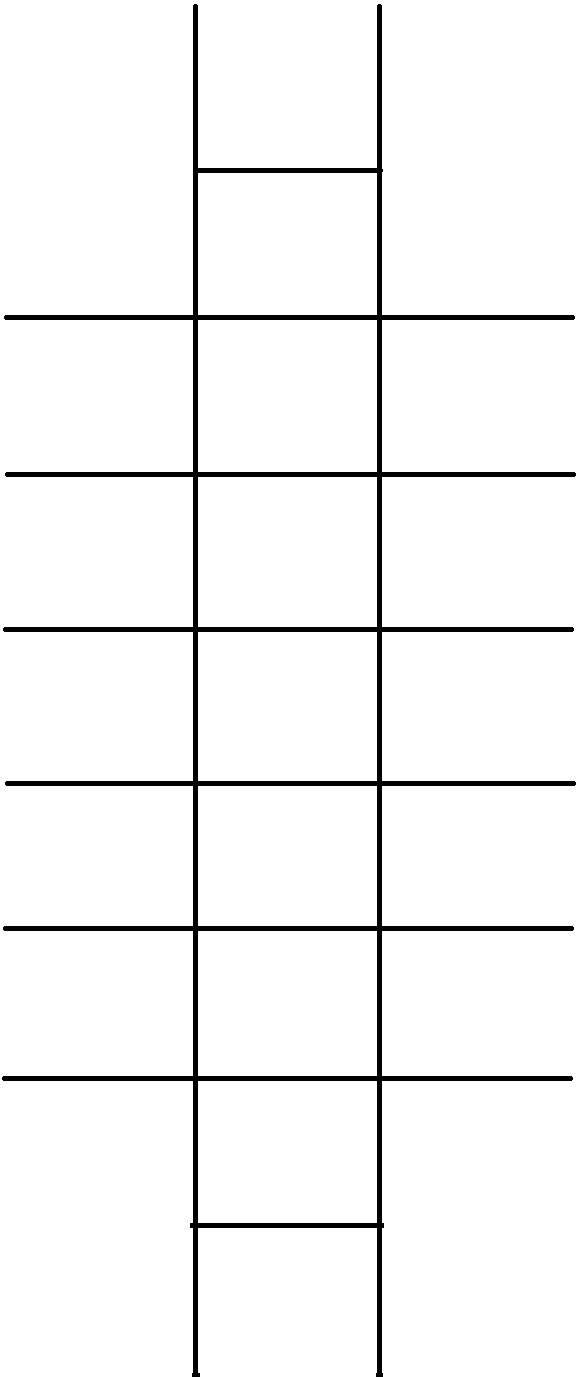
You might think, “How do we get a tetrahedron from this?”
We don’t. Not really. This is where the majority of four-part figures will be placed.
So please, bear with me.
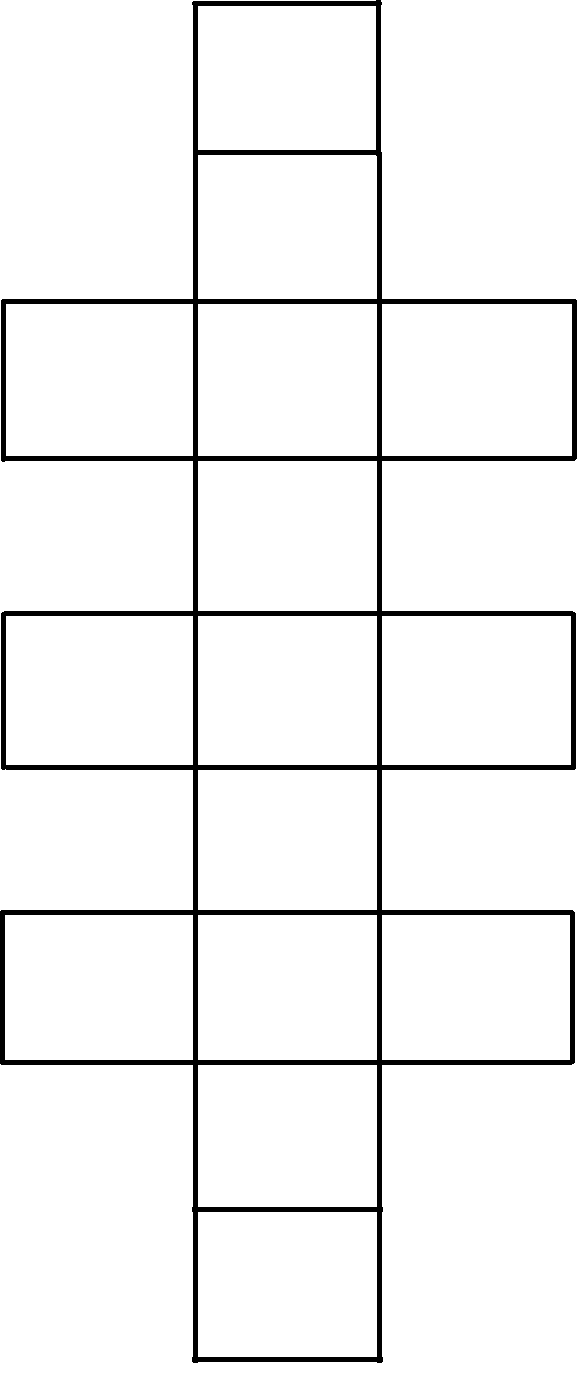
- At the very top of the vertical lines, connect the two with a horizontal line.
- On the left and the right sides, connect the top two horizontal lines to make a box.
- Go down the chart and skip making a box connecting to the next horizontal line.
- Continuing down the chart, connect the horizontal lines in pairs, alternating between empty spaces and boxes.
- Finally, close the bottom of the chart with a horizontal line connecting the two vertical lines.
- Shade in (or otherwise eliminate) three center boxes starting from the second from the top.
- These boxes will not be used.
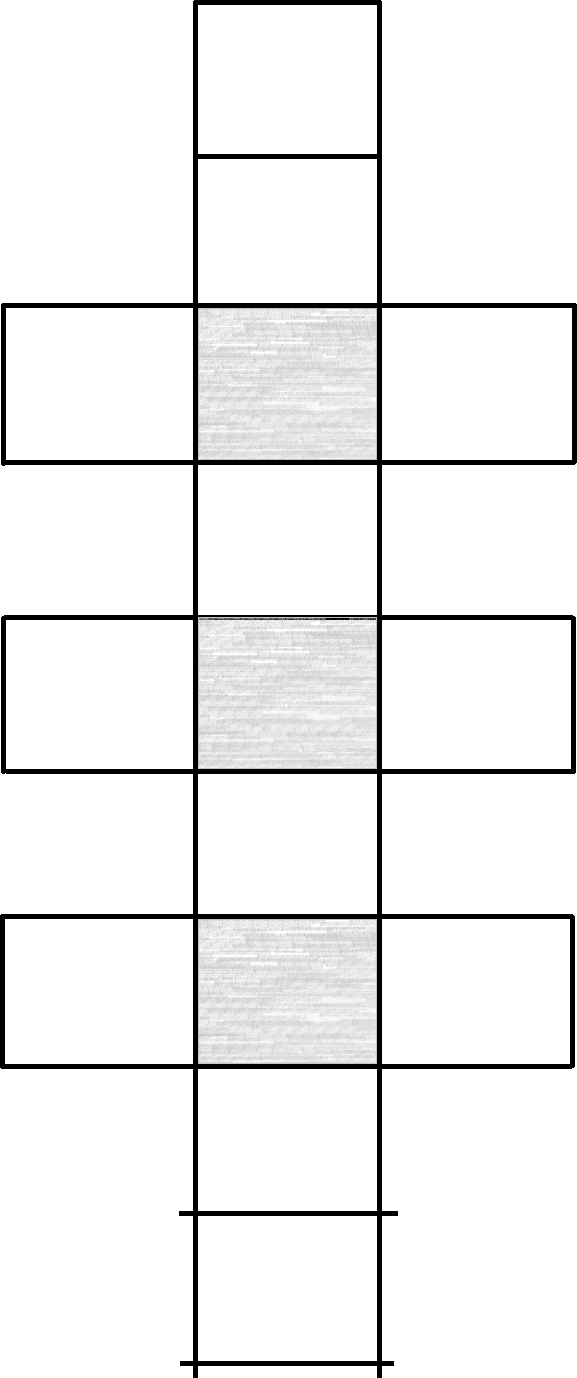
- Draw two independent boxes off to the right and left of the chart, level with the lowest box in the stack.
- Draw connecting lines between the three boxes on the bottom row.
- Connect the bottom-left and bottom-right boxes to the highest left and right boxes on the stack.
- Connect the highest left and right boxes on the stack to the highest box on the chart.
You should end up with something like this.
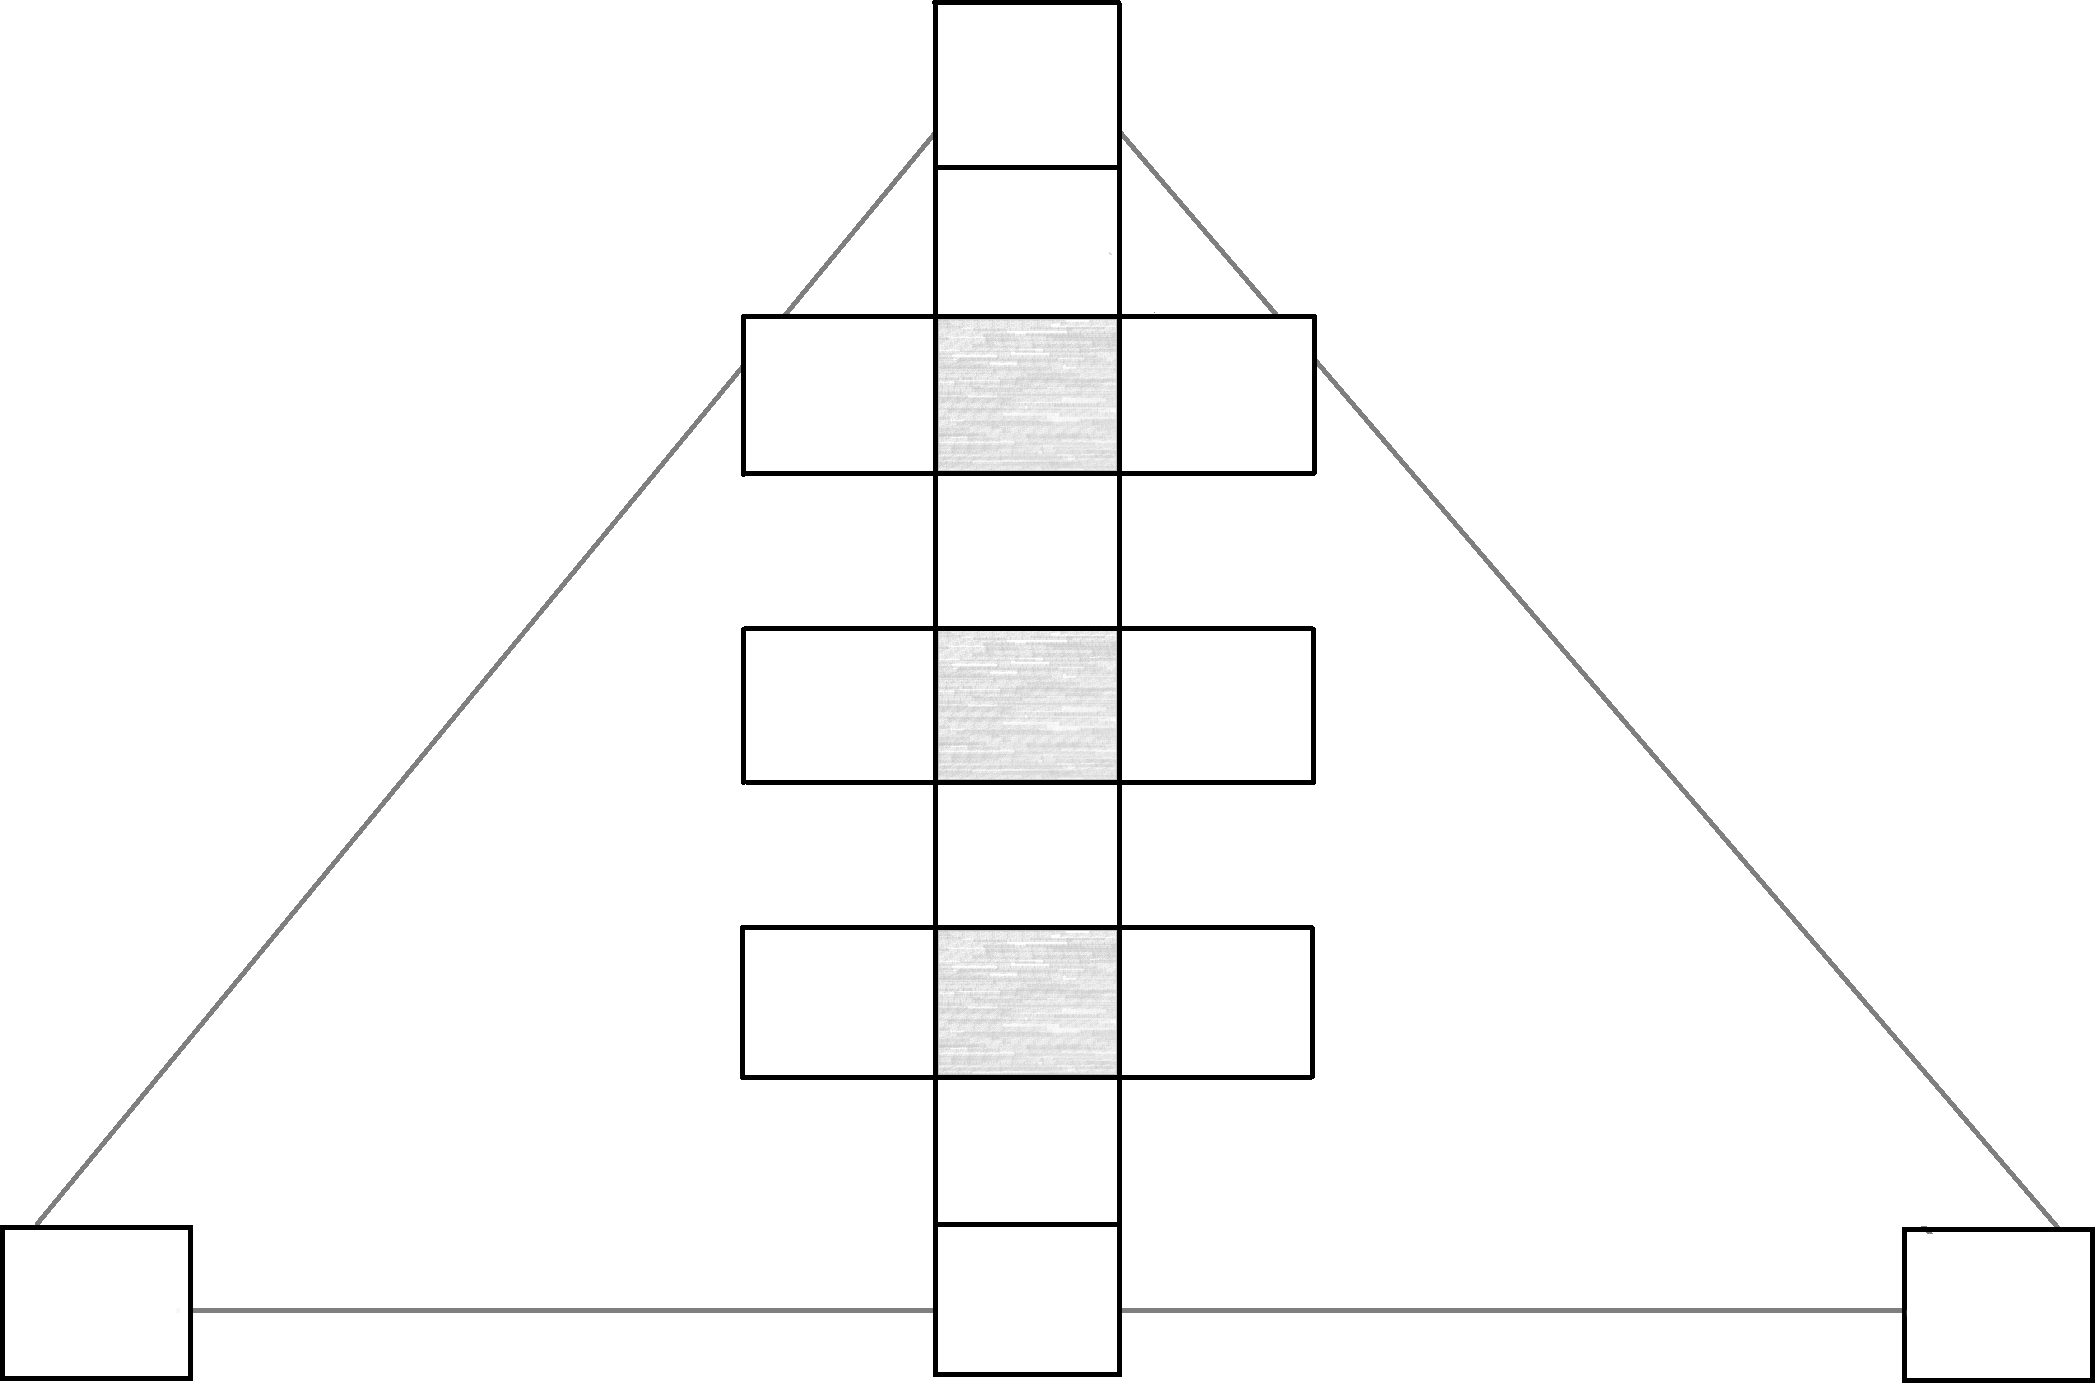
At this point, you are technically done.
This chart can be filled with figures.
However, I said this was a tetrahedron, and it still doesn’t look like one. You might want to make it look more like a tetrahedron.
- To really make it look like a tetrahedron, draw diagonal lines connecting the lowest left and right boxes of the stack.
- Connect those two left and right boxes to the center box just above them.
- Indicate a vertical line in the unused boxes to the highest center box.
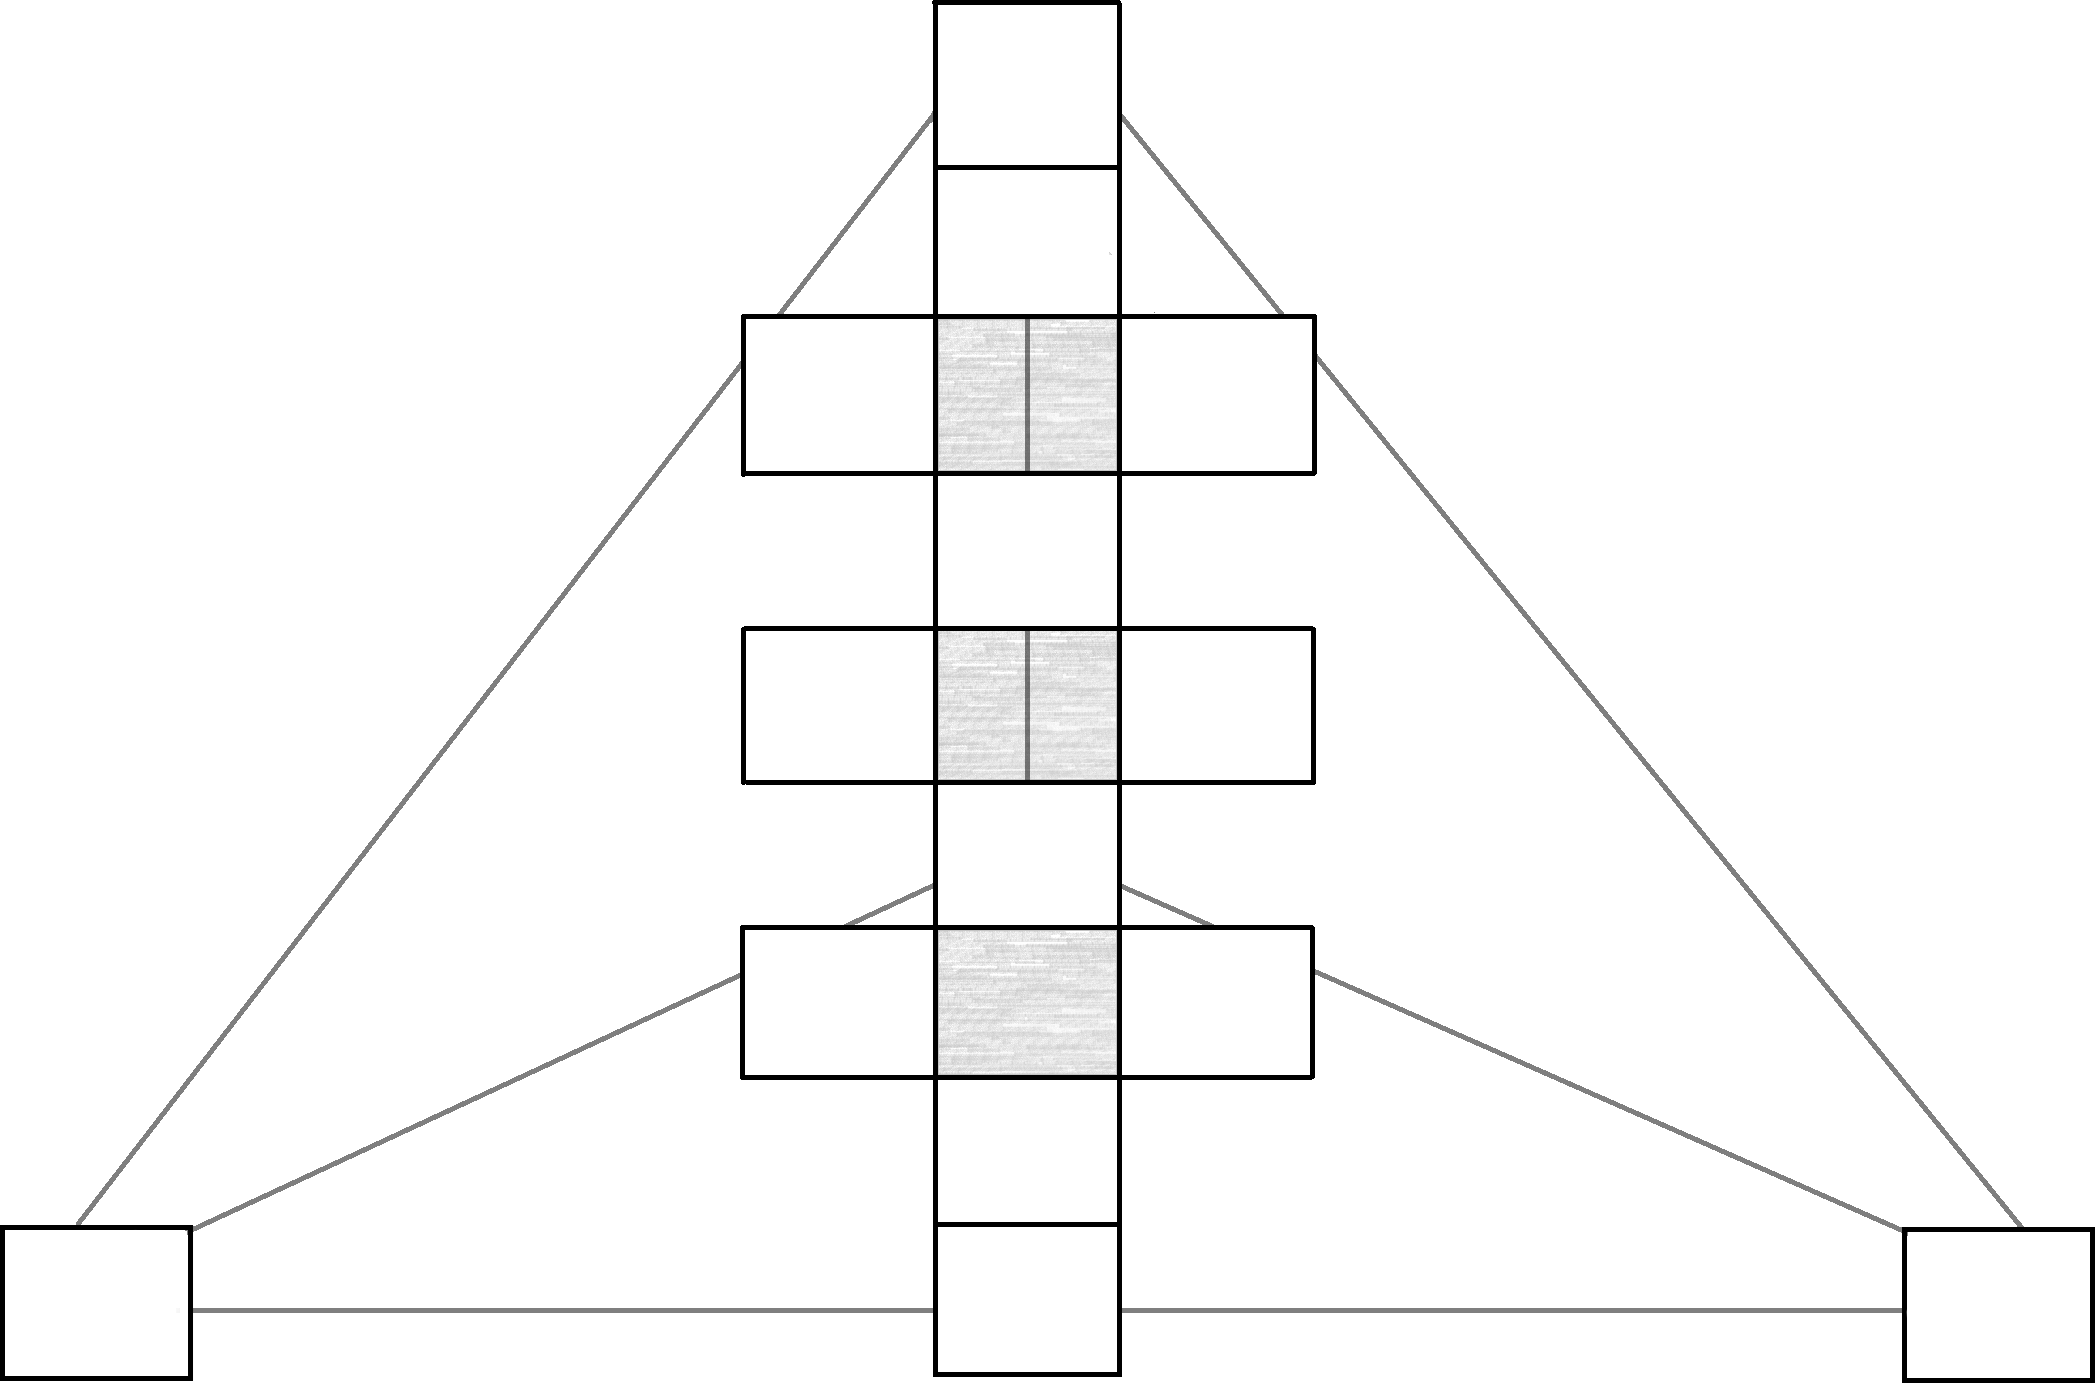
And there you have it! The chart is ready to be filled in!
You may wish to refer to the next section for instructions on how to fill in the chart.
You may also wish to refer to the chart vocabulary for information about what each space in the chart represents.