Once you have generated four figures and have drawn the outline for the chart, you will want to fill in the chart for subsequent intrepretation.
But with fifteen placements to fill, where do you start? And how do you fill in the rest with only four figures to work with?
That’s what this article will cover.
The Sources
These are the four angles. The angles are labeled A, B, C, and D.
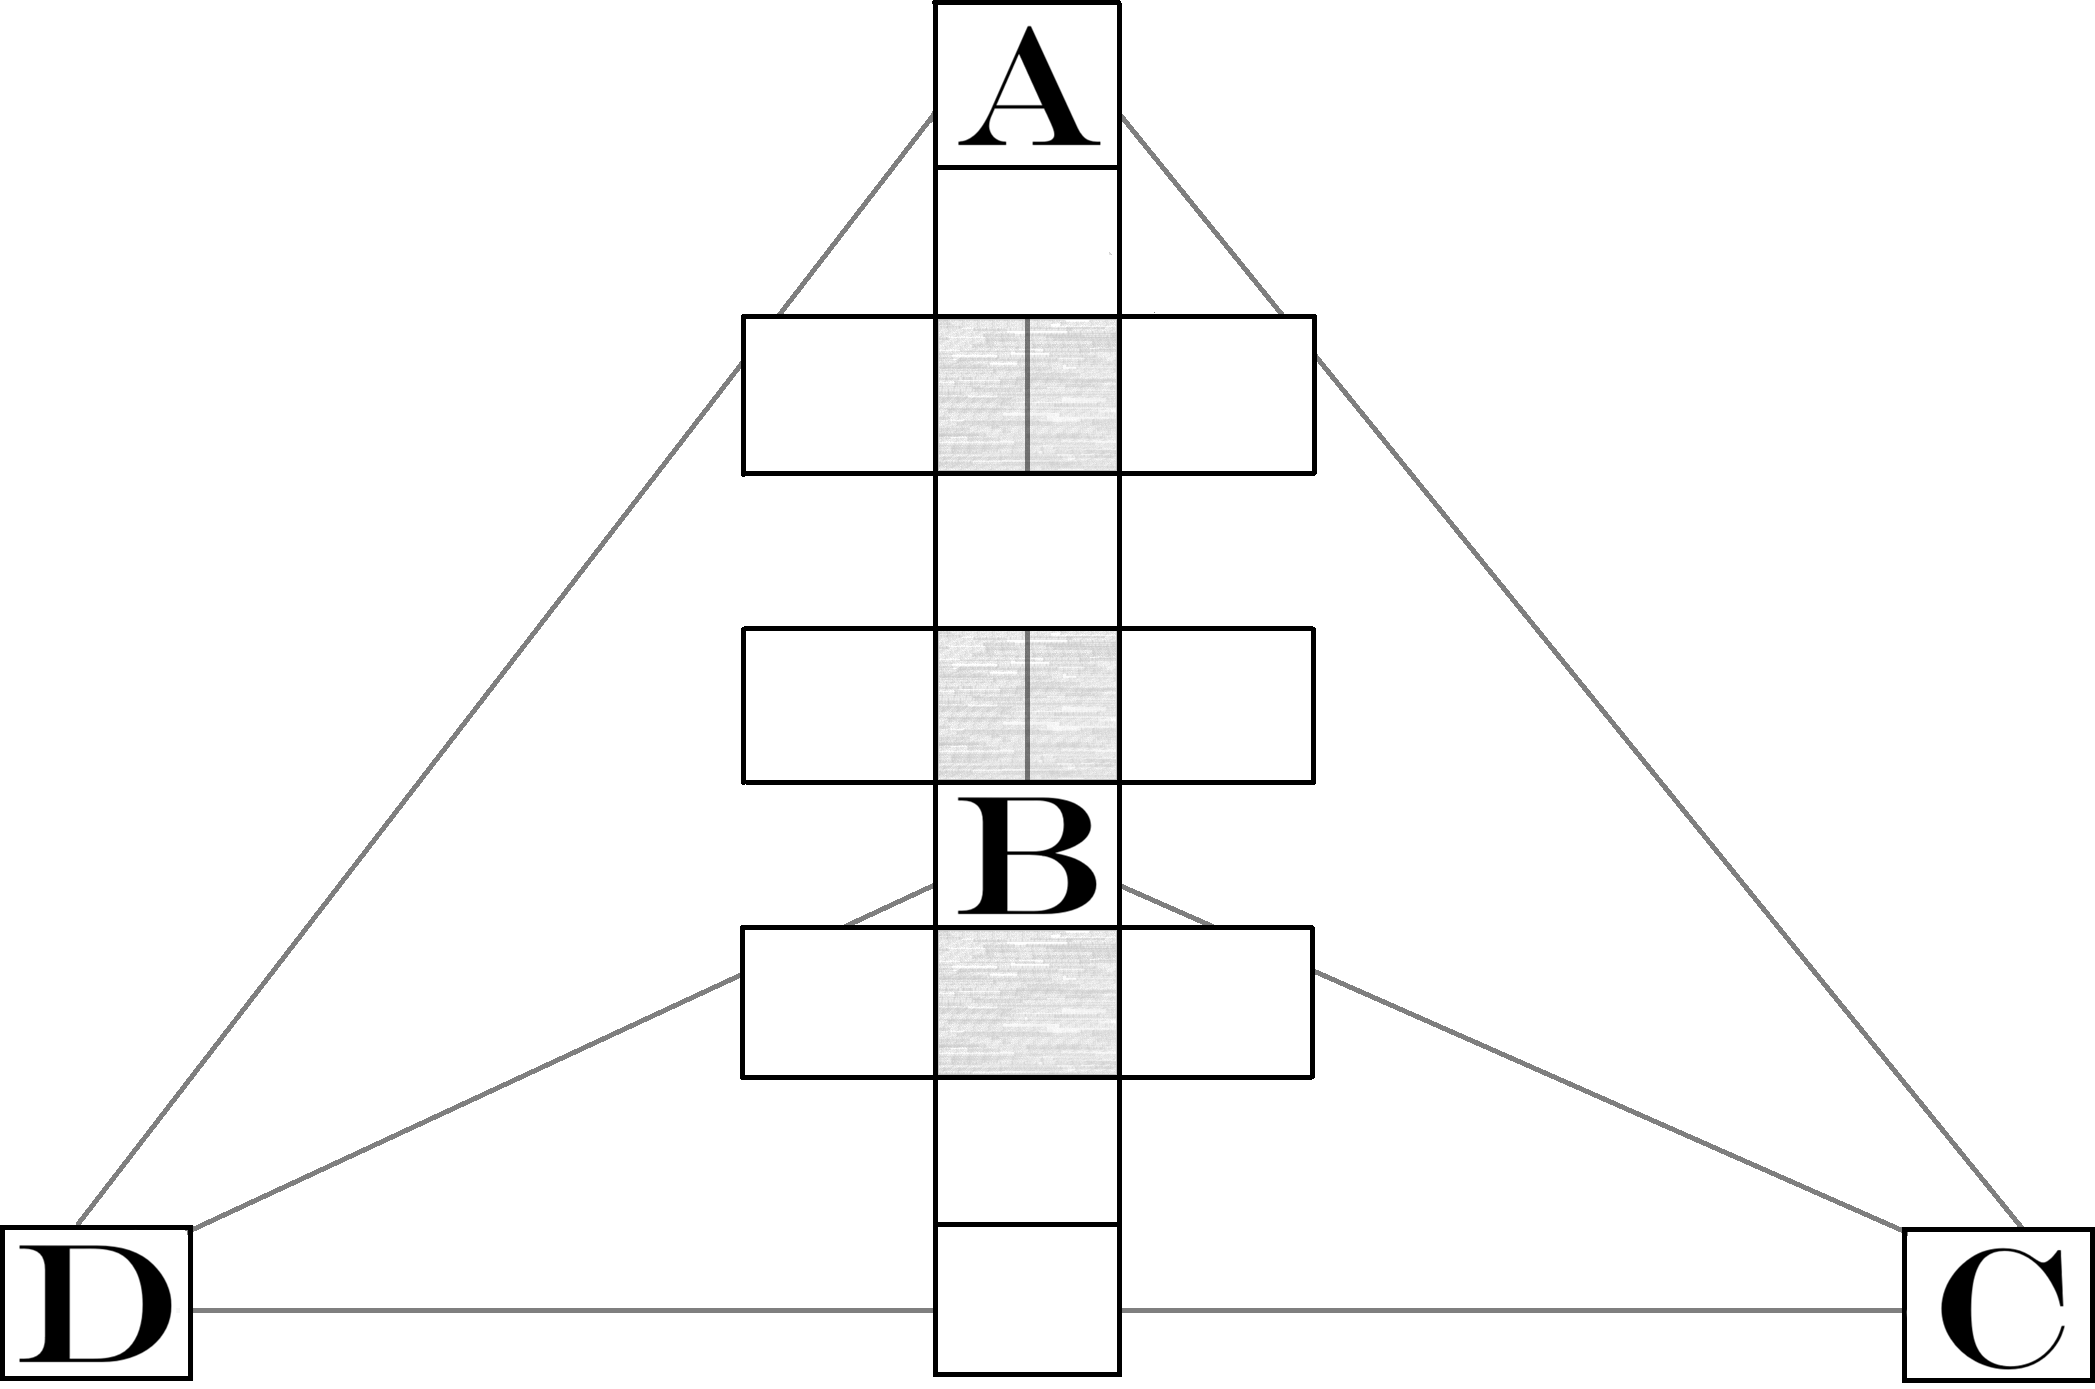
The first figure goes in the A position, the second in the B position, the third in the C position, and the fourth in the D position.
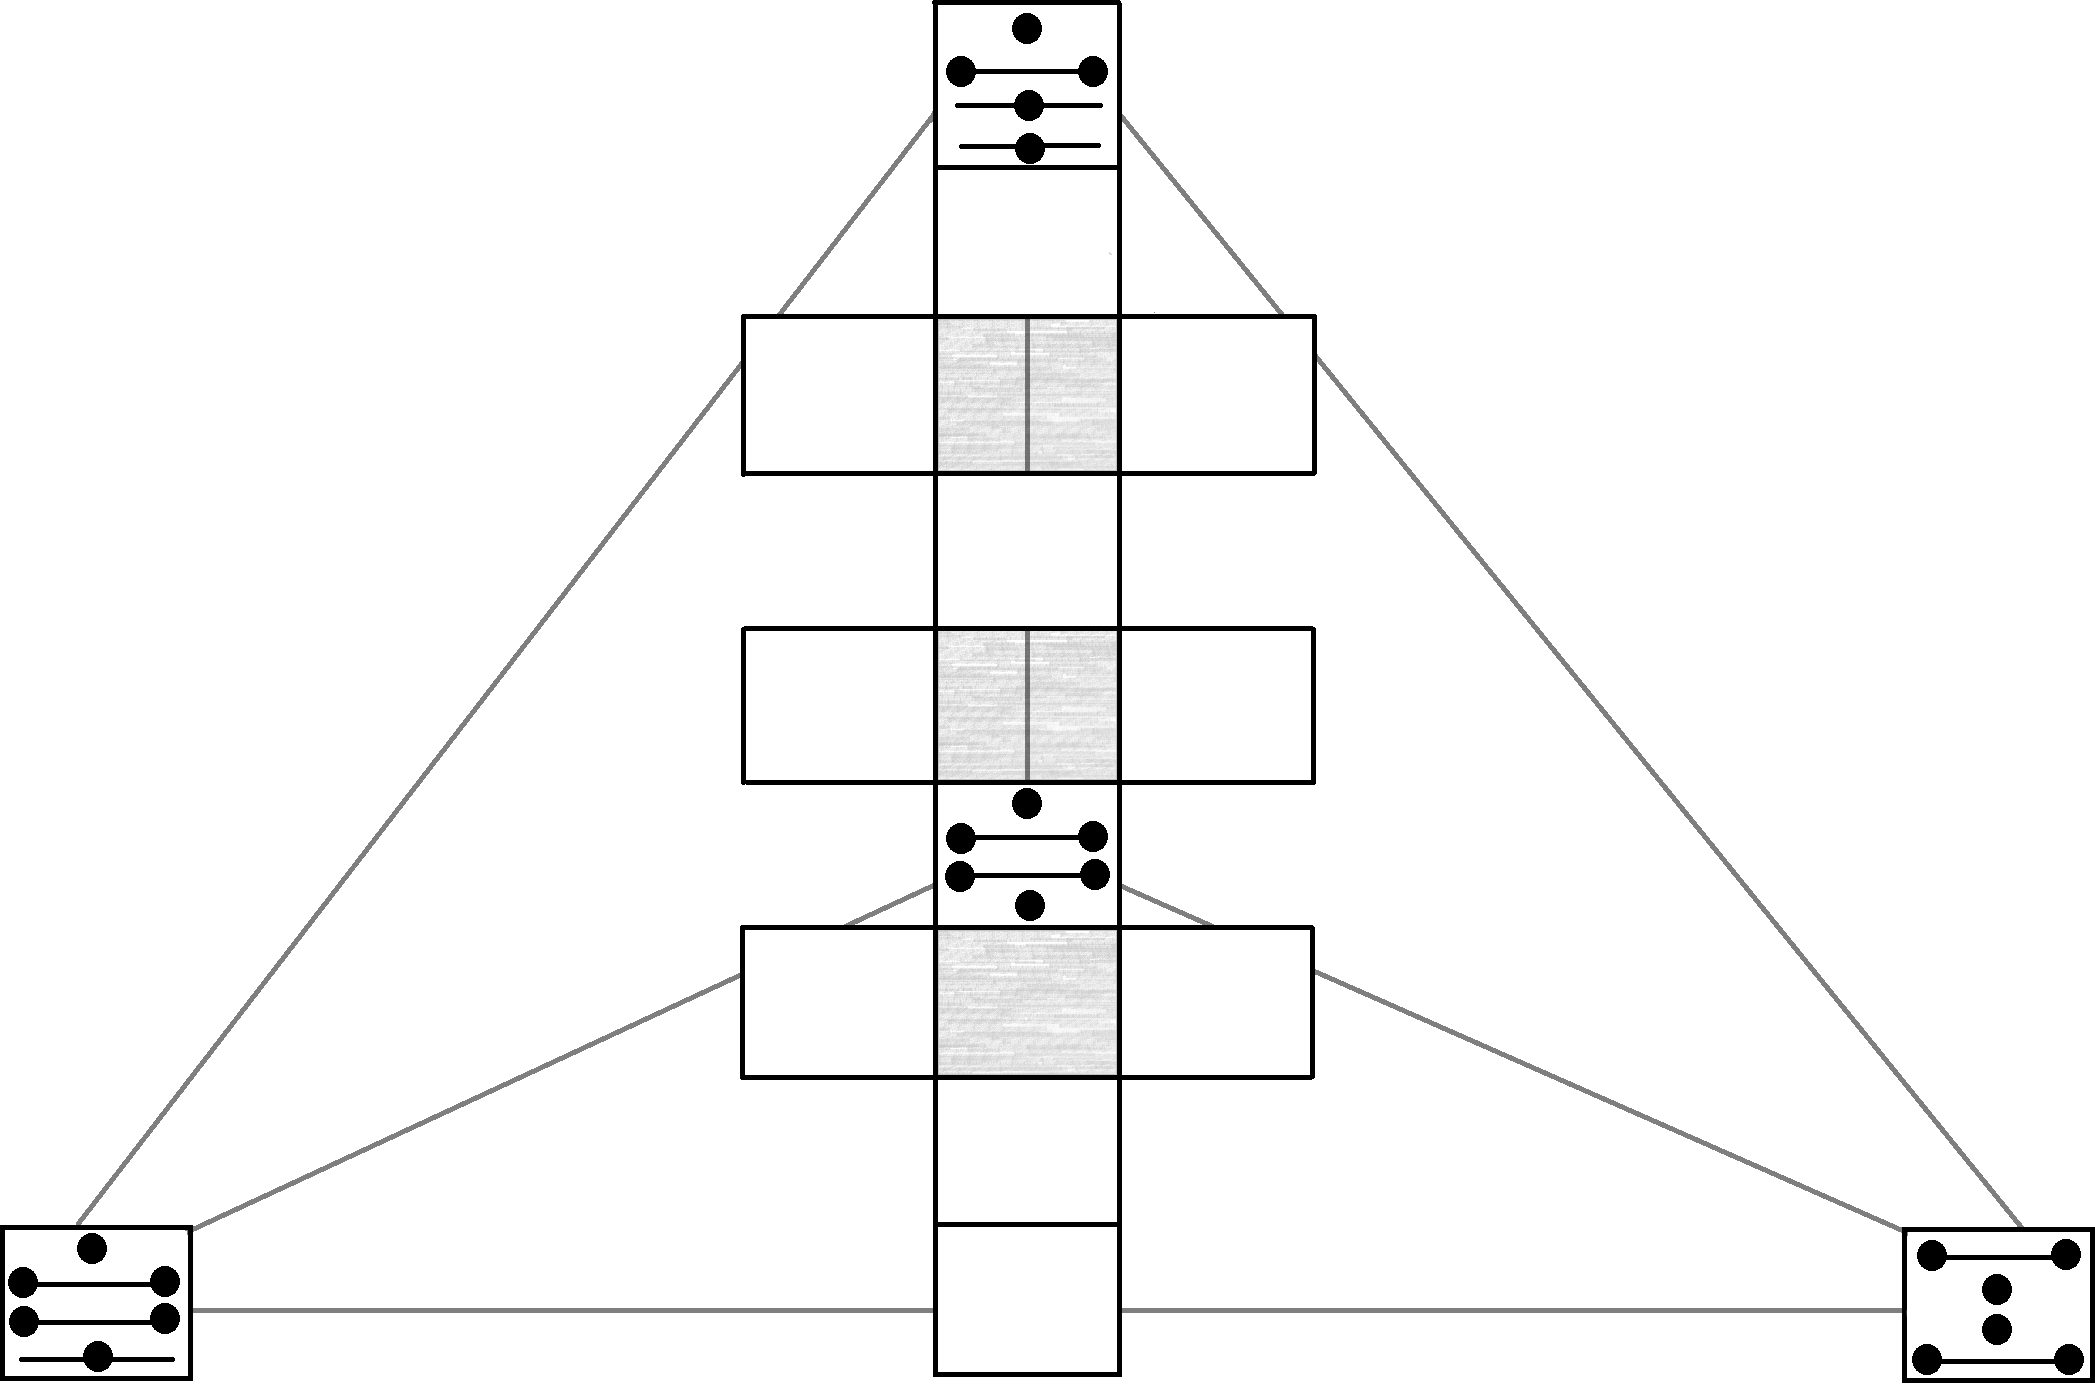
Suppose you generated the following figures:
First Figure



Second Figure
Third Figure
Fourth Figure
The Four Sources Placed
This is where they will end up:
Great. Now what?
The Six Bounds
By “bounds” we mean “edges”; these are the six edges of the tetrahedron.
If you recall where A, B, C, and D are, you’ll be able to easily see how these take form.
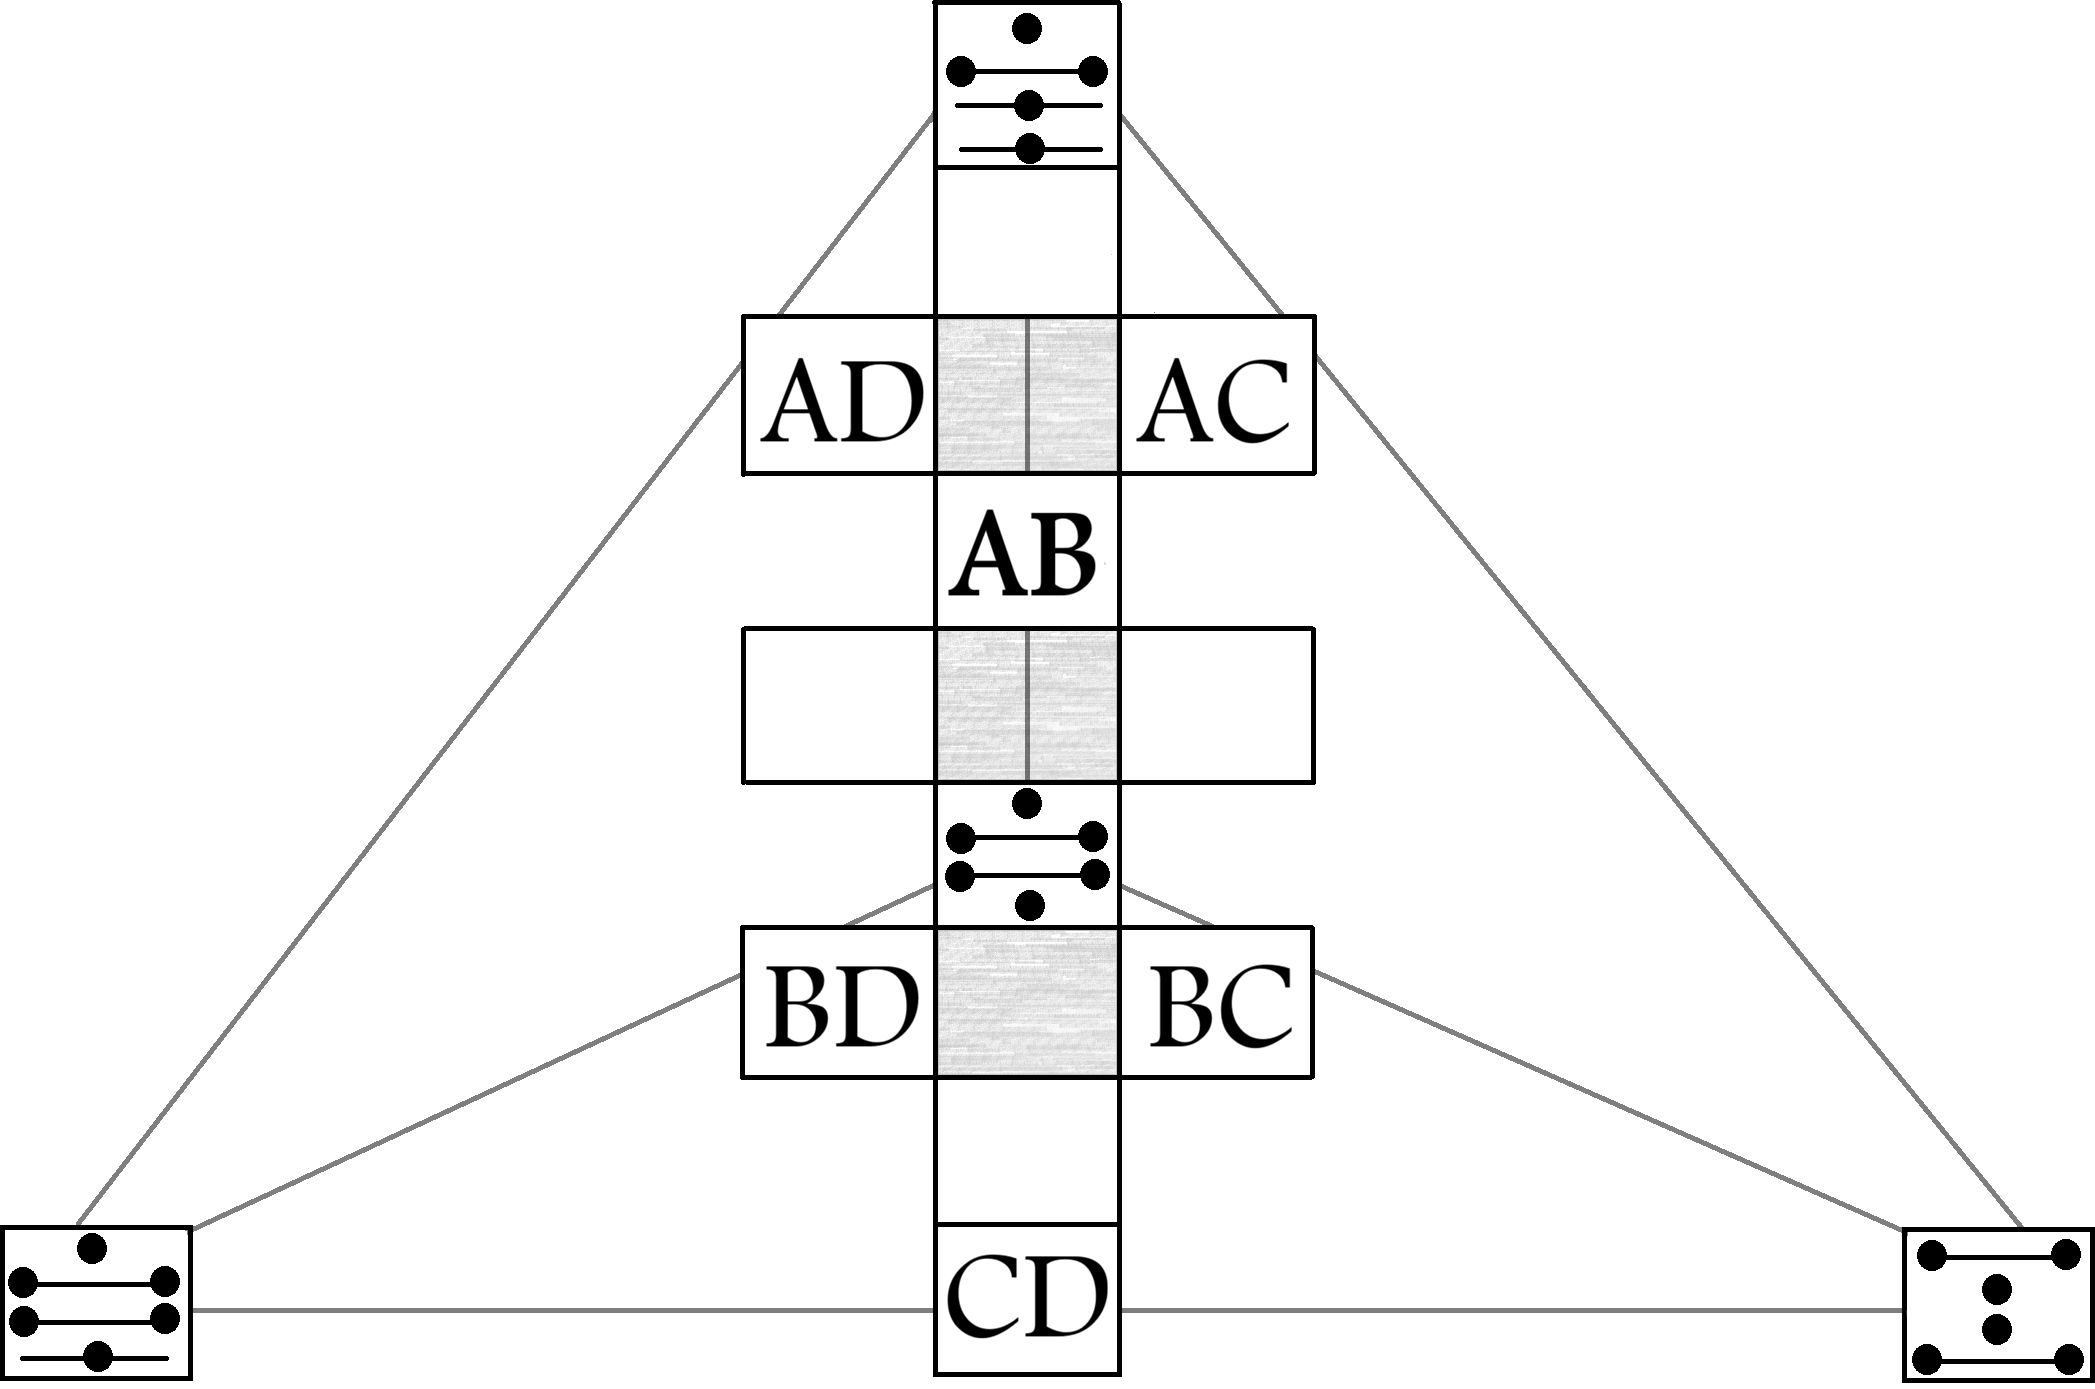
If AD is the join of A and D, how do we represent this with the two figures, A and D?
The trick to Tetriamancy is two figures can combine to result in a third figure. This is done by calculating how the states change.
Here are four charts representing the same information.
Addition
Table One
This is the same information as Table Three.
| Glyph One | Glyph Two | Result | ||
|---|---|---|---|---|
| Manifest | + | Manifest | = | Latent |
| Manifest | + | Liminal | = | Manifest |
| Manifest | + | Latent | = | Liminal |
| Liminal | + | Liminal | = | Liminal |
| Liminal | + | Latent | = | Latent |
| Latent | + | Latent | = | Manifest |
Table Two
This is the same information as Table Four.
| + | Manifest | Liminal | Latent |
|---|---|---|---|
| Manifest | Latent | Manifest | Liminal |
| Liminal | Manifest | Liminal | Latent |
| Latent | Liminal | Latent | Manifest |
This is the same as the Table One.
| Glyph One | Glyph Two | Result | ||
|---|---|---|---|---|
|
+ | |
= | |
|
+ | |
= | |
|
+ | |
= | |
|
+ | |
= | |
|
+ | |
= | |
|
+ | |
= | |
Table Four
This is the same information as Table Three.
| + | |
|
|
|---|---|---|---|
|
|
|
|
|
|
|
|
|
|
|
|
Use whichever table is easiest for you.
Quick note
More information about the implications of what these figures mean and why these combinations lead to these results will be covered in the Ontology article. Further information about why these particular glyphs were chosen is covered in the Design / Methodology article.
Upon Successful Math
Anyway, this is the result.
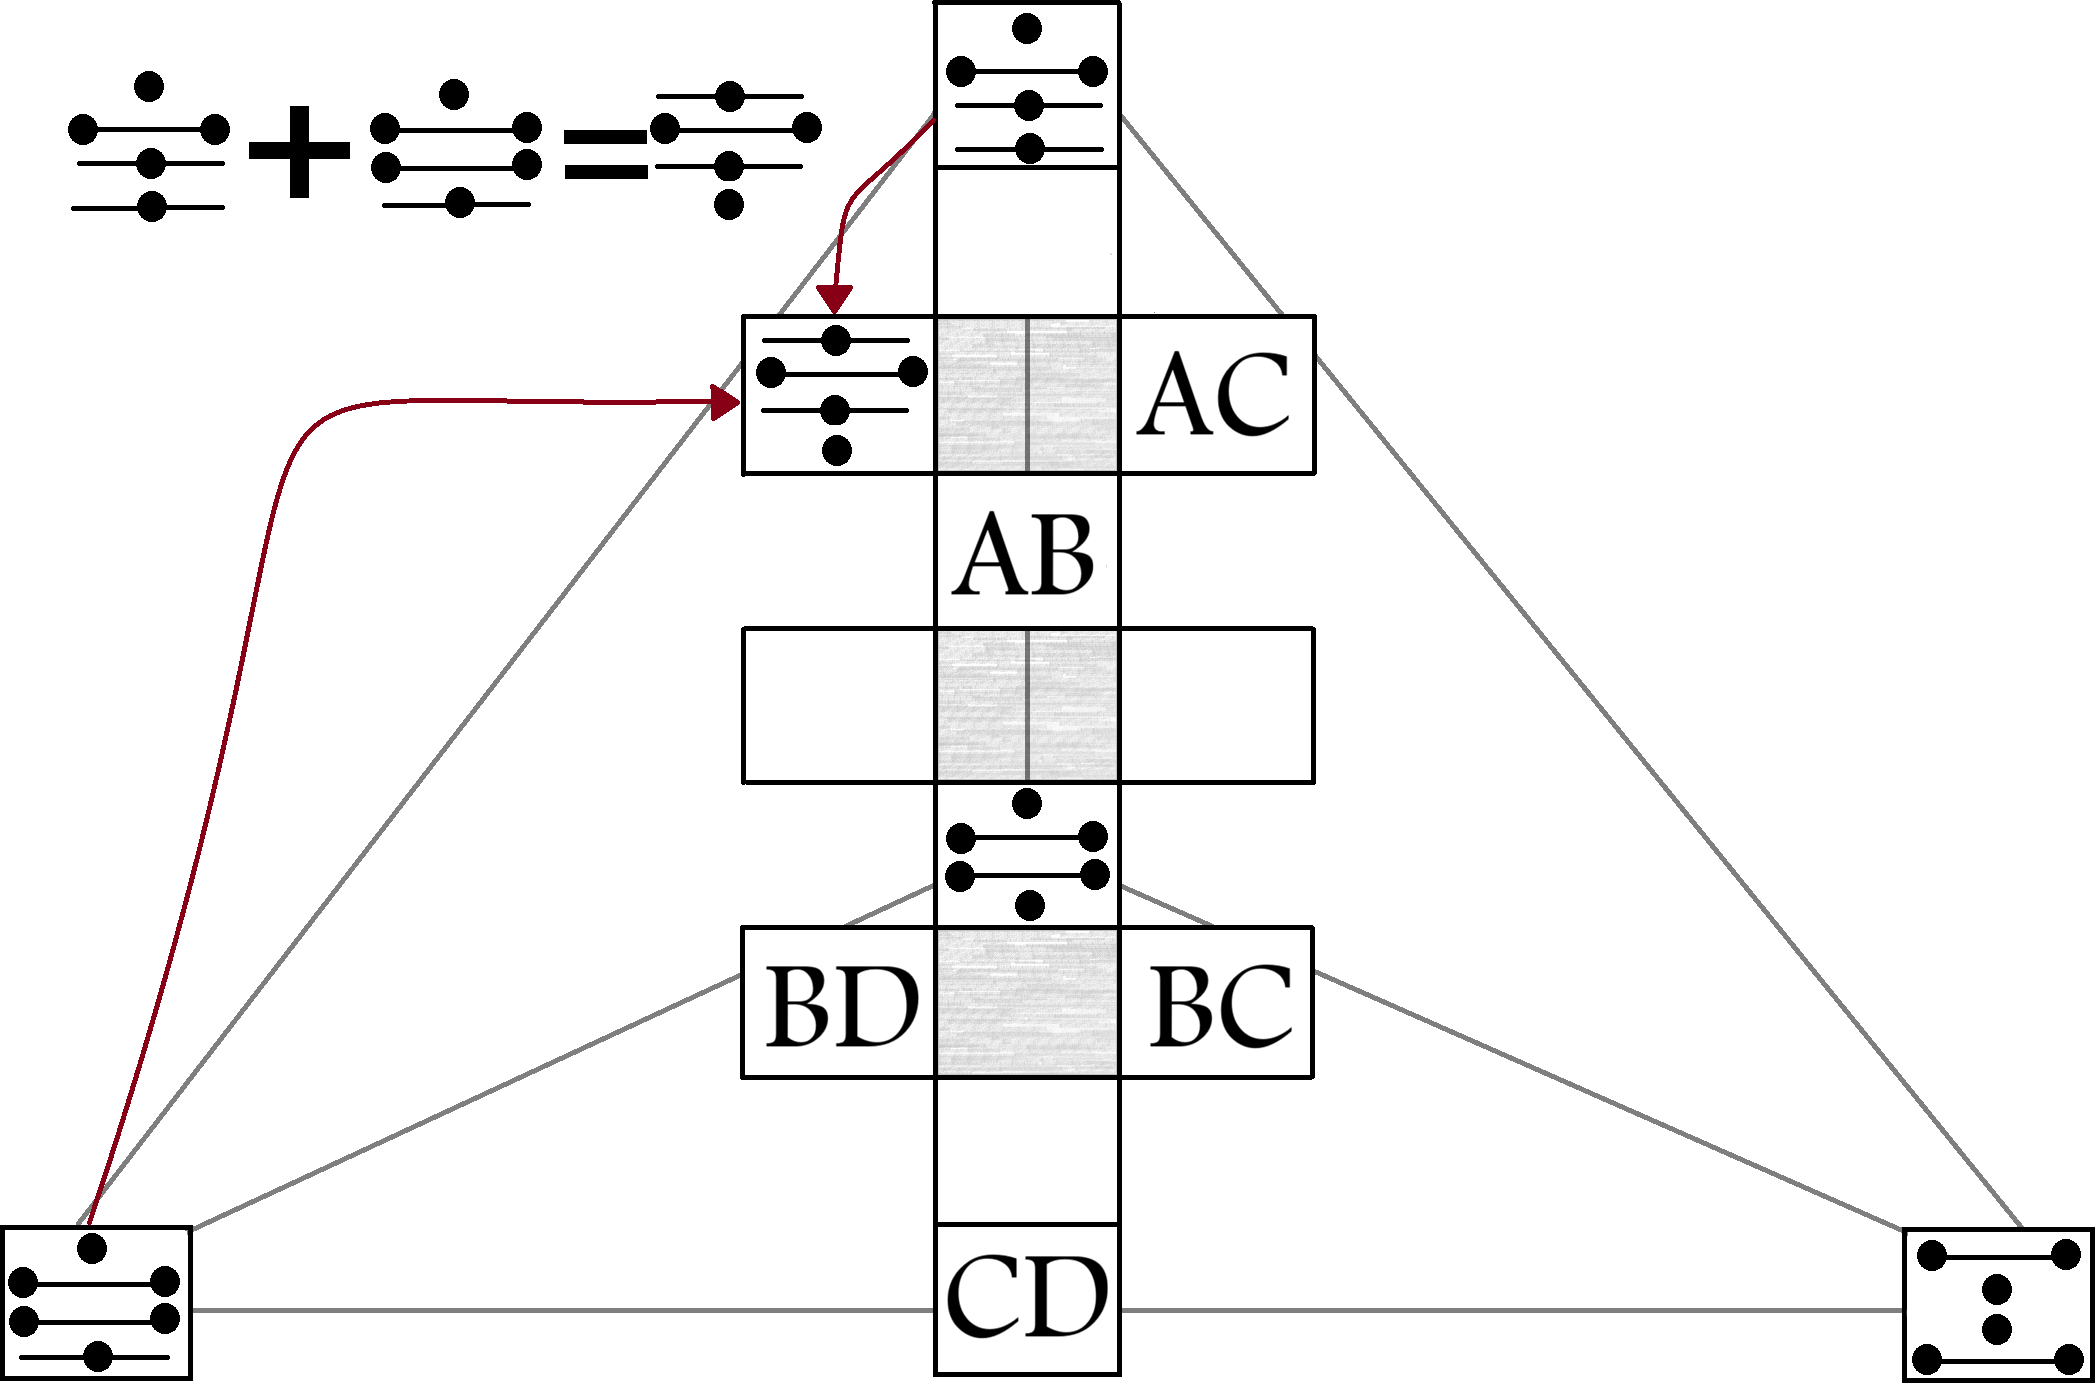
I would highly encourage you to review the tables above and the calculation in the image until you understand what’s happening.
The Four Fields
Once you understand how to generate AD, the remaining bounds are easy enough to generate.
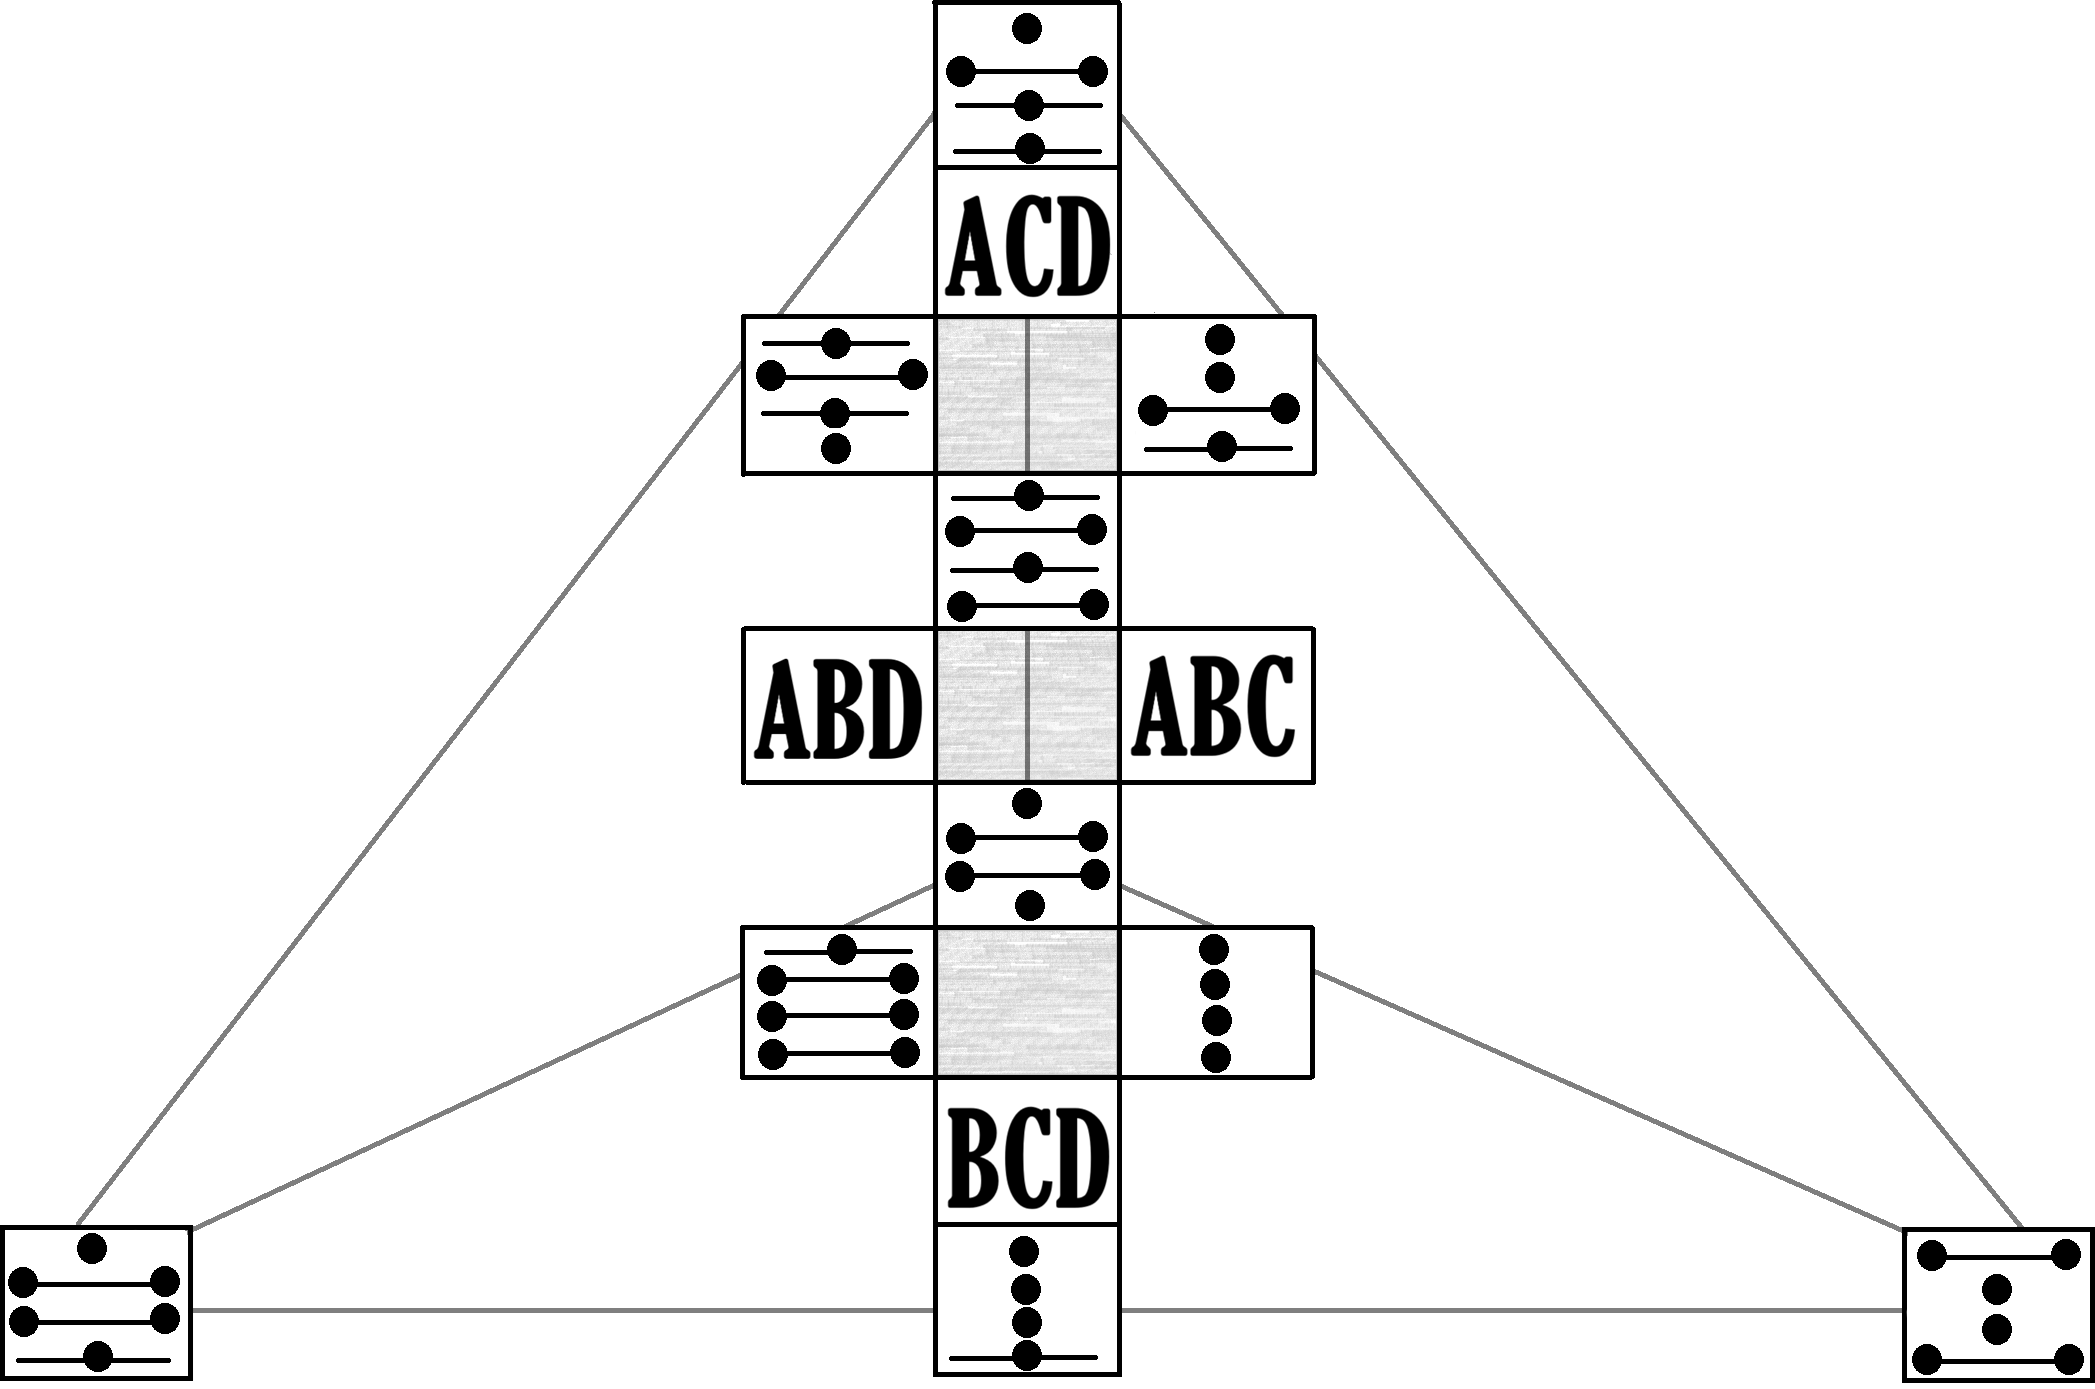
You’ll see that there are now four new sets of letters: ABC, ABD, ACD, and BCD.
These are the Four Fields: the surfaces of the tetrahedron.
Calculating those is much the same:
We will derive ABD from AB and D using the same procedure as before.
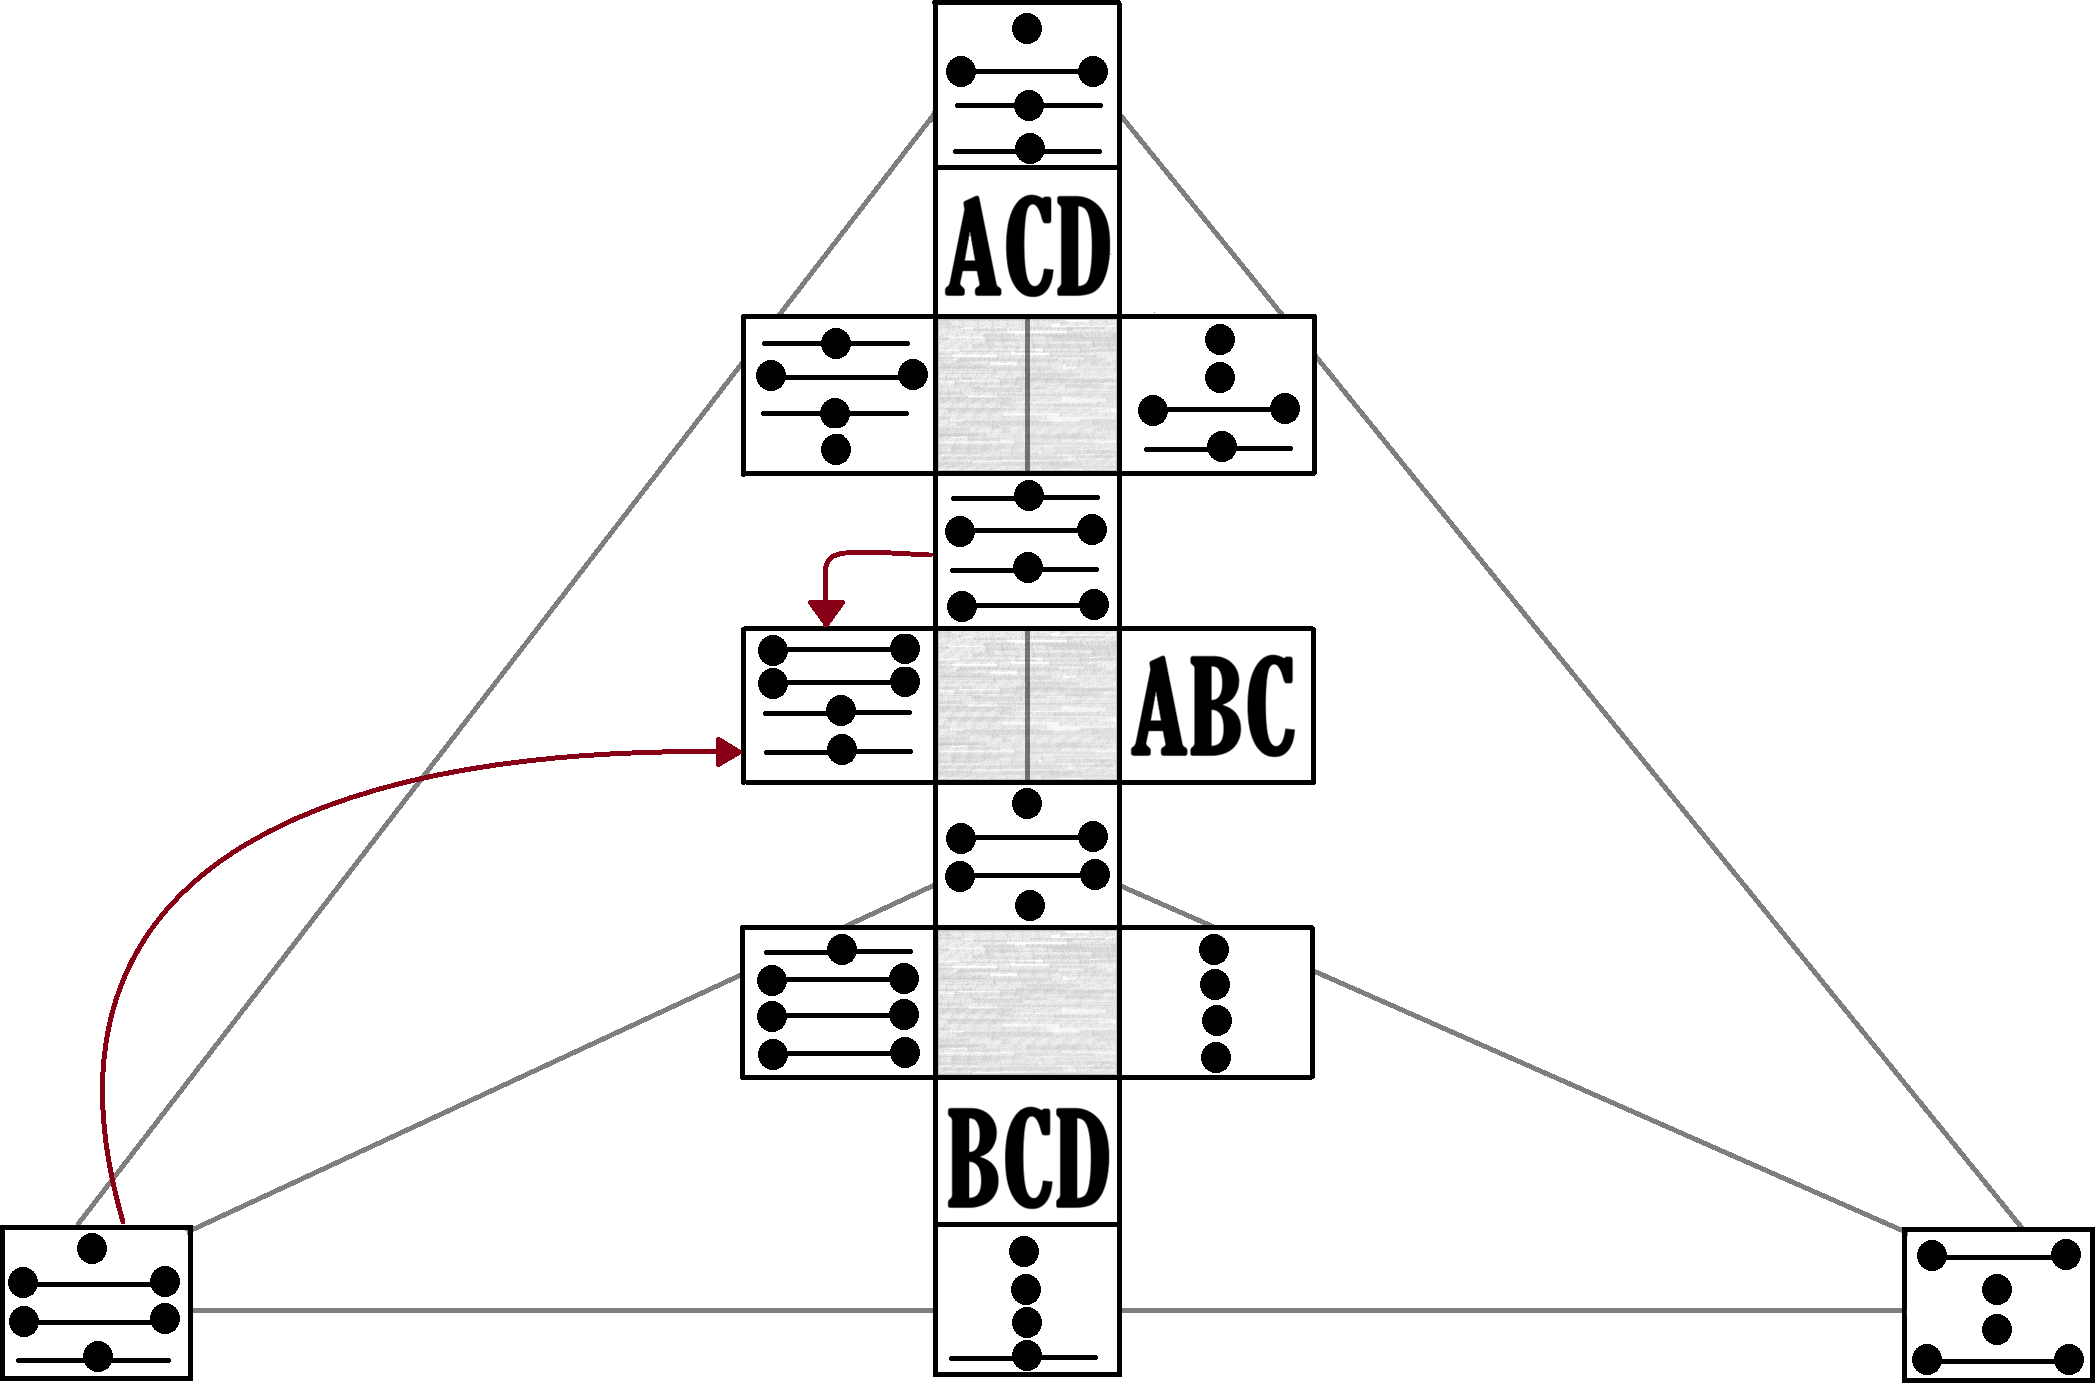
Refer to Addition if you run into difficulties adding figures together.
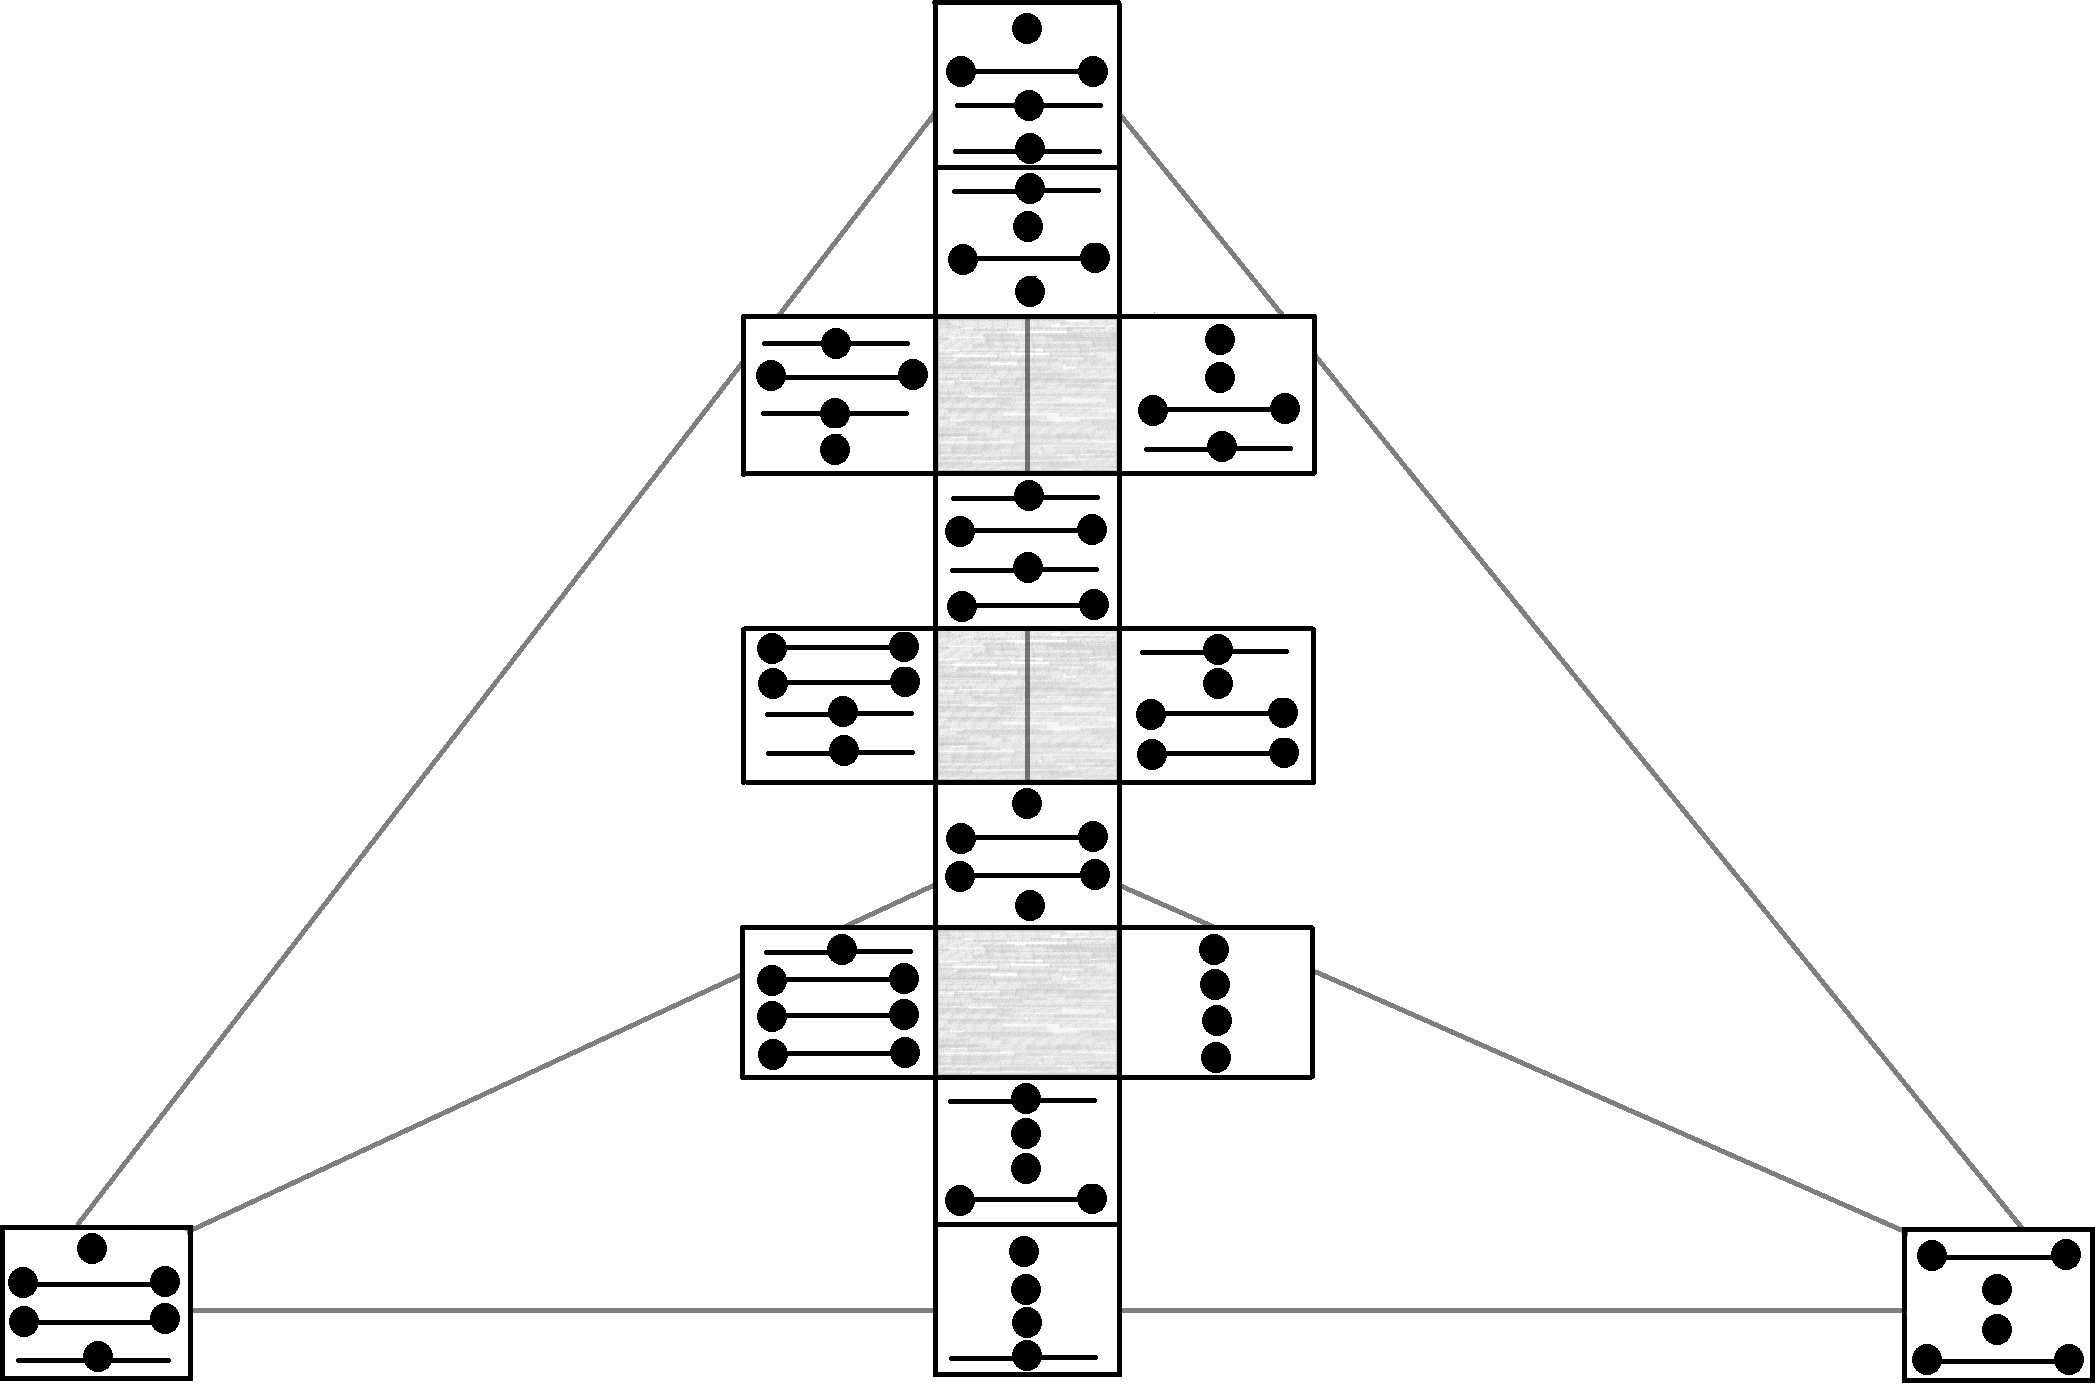
Following the same process, we can calculate the remaining three Fields.
The Whole
There is yet another part of the tetrahedron that is not laid directly on the tetrahedron—the Whole.
The Whole is represented by ABCD.
You may, however you wish, calculate ABCD from its parts: either ABC + D, ABD + C, ACD + B, BCD + A—you may do it however you’d like.
Once you do so, place it on top of the chart.
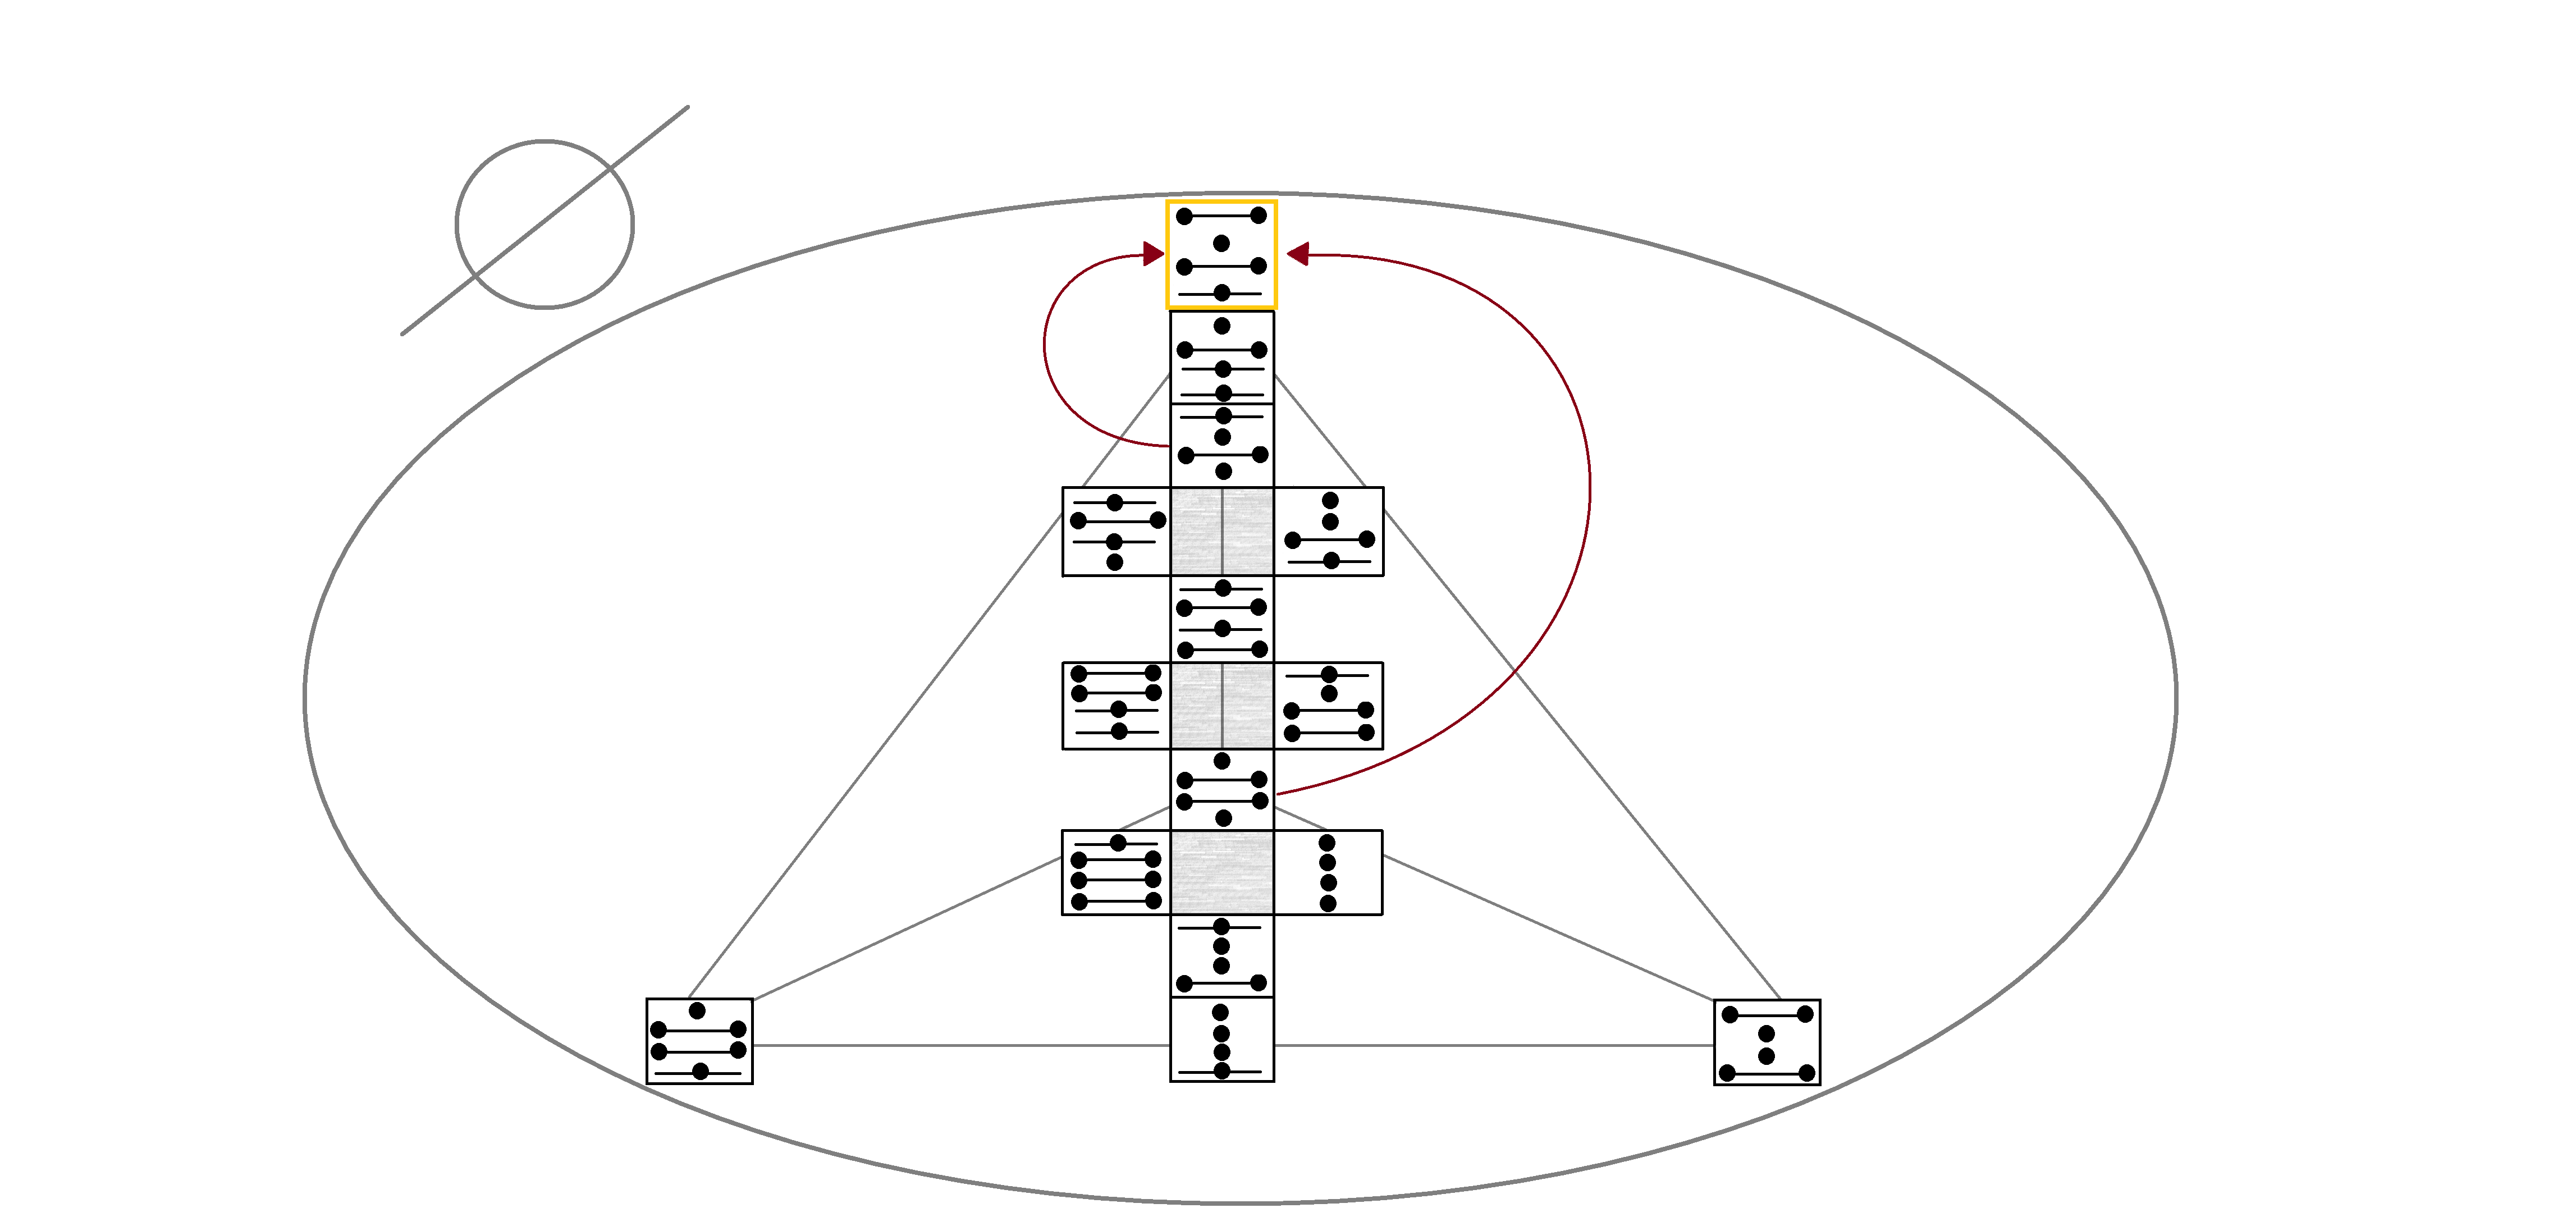
And thus, we have completed our calculations.
You probably noticed the null sign and the circle that were added.
I’d love to say that this is a tradition, as it ties heavily into the Ontology present in the system—but Tetriamancy did not exist beyond me until this website.
Therefore, do as you Will.
The Completed Chart
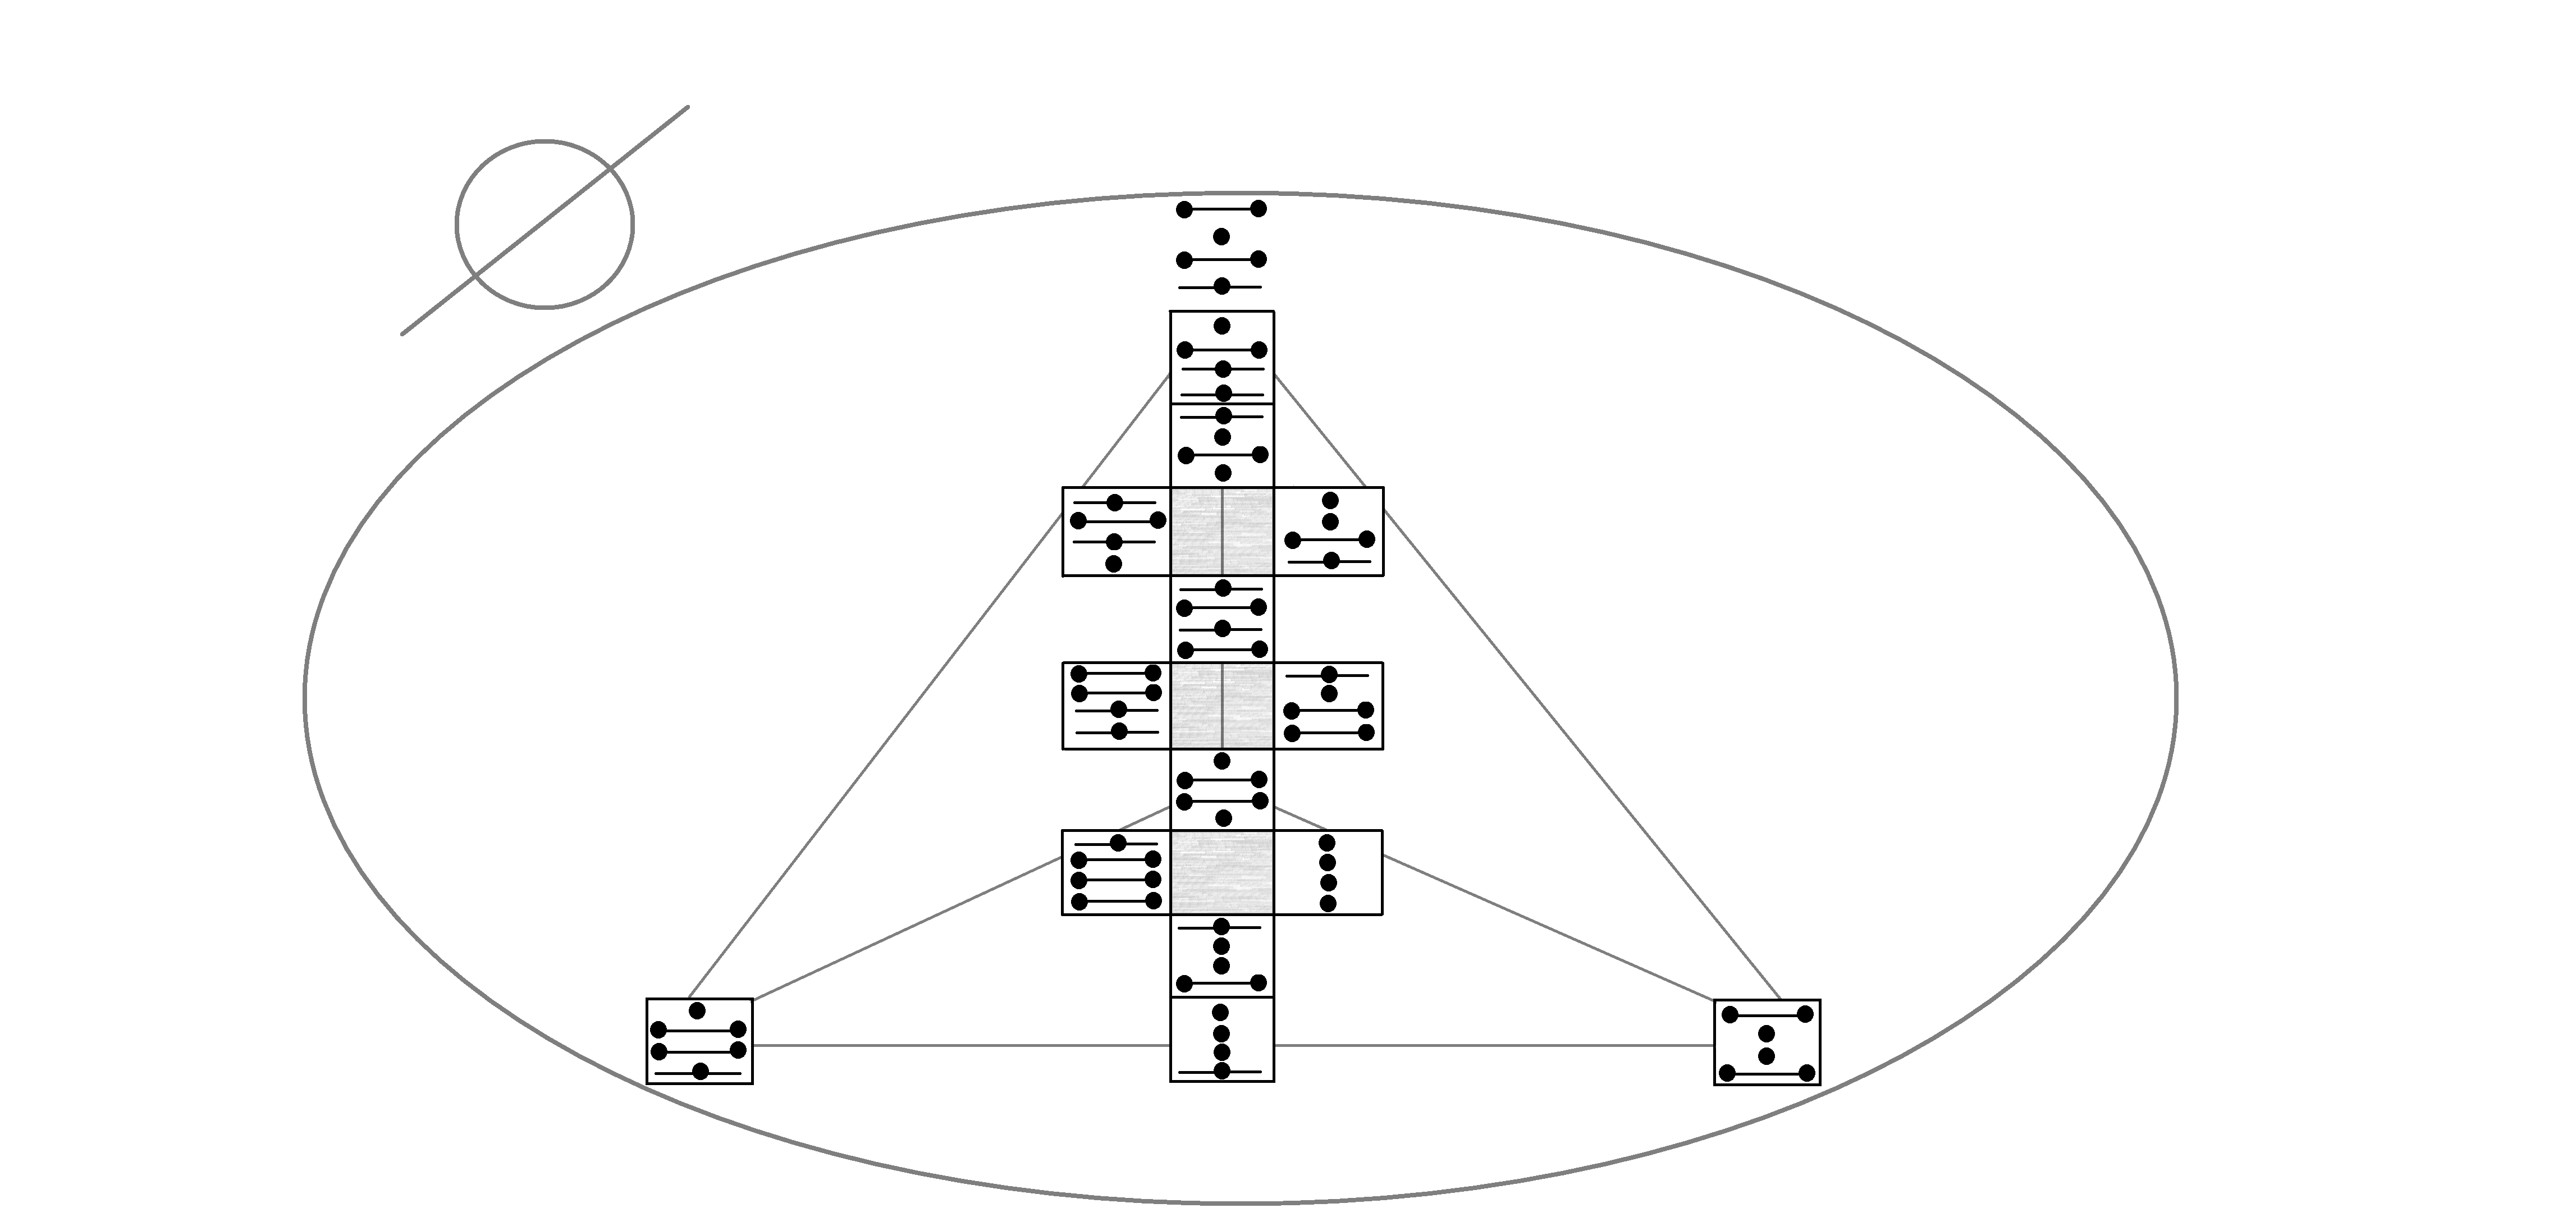
It will take you some time to be able to create a chart on your own; it takes practice.
Don’t get down on yourself if you make mistakes; double-check your work. If you find errors, correct them, recognize you are learning, and keep it up.
However, we are far from finished.
Once we have generated a Tetriamantic chart, we must interpret the chart.
That is what we will do next.